EFK Stack deployment on Kubernetes
Full setup, including yaml manifest files, for a single node test system, collecting logs from nginx.
Table of Contents:
Intro
Logs produced by running containers, written to stdout/stderr are, by default, stored on host machine at /var/log/container.
Logrotation is pretty frequent, therefore either you collect and store them somewhere, or they will be soon gone for the good.
At some point, you might (will) need to analyse logs, so it’s a good idea to set up a framework to do so already from the beginning.
Moreover, rather than scrolling text files, having them available as structured data and on a web UI will help a lot, when it comes to log analysis.
An EFK (Elasticsearch – Fluentd – Kibana) stack allows you to do so. A possible alternative is made of ELK (Elasticsearch – Logstash – Kibana).
This post will guide you through all necessary steps to do so. As sample case, we will be collecting (JSON) logs from an nginx container and they will be available on Kibana.
Components
- Fluentd – the log aggregator used to collect container stdout/stderr logs and (optionally) process them before sending them to Elasticsearch
- Elasticsearch – provides a scalable, RESTful search and analytics engine for storing Kubernetes logs
- Kibana – the visualization layer, allowing you with a user interface to query and visualize logs
Prerequisites
- A Kubernetes cluster running on a Linux host VM
- kubectl utility, configured to interact with the cluster above
Step 1: Elasticsearch deployment
- Create a Service using the following yaml manifest
kind: Service
apiVersion: v1
metadata:
  name: elasticsearch
  namespace: default
  labels:
    app: elasticsearch
spec:
  selector:
    app: elasticsearch
  clusterIP: None
  ports:
    - port: 9200
      name: rest
    - port: 9300
name: inter-node- Create a persistent volume to be assigned to the elasticsearch pods
- Make sure that .spec.local.path points to a folder existing on host VM local filesystem
- Make sure that .spec.nodeAffinity.required.nodeSelectorTerms.matchExpressions.values matches with kubernetes’ cluster node name
apiVersion: v1
kind: PersistentVolume
metadata:
  name: data
  namespace: default
spec:
  accessModes:
  - ReadWriteOnce
  capacity:
    storage: 5Gi
  persistentVolumeReclaimPolicy: Retain
  local:
    path: /u01/elastic
  nodeAffinity:
    required:
      nodeSelectorTerms:
      - matchExpressions:
        - key: kubernetes.io/hostname
          operator: In
          values:
- your_node_name- Create a StatefulSet (sample below runs on a single node configuration)
apiVersion: apps/v1
kind: StatefulSet
metadata:
  name: es-cluster
  namespace: default
spec:
  serviceName: elasticsearch
  replicas: 1
  selector:
    matchLabels:
      app: elasticsearch
  template:
    metadata:
      labels:
        app: elasticsearch
    spec:
      containers:
      - name: elasticsearch
        image: docker.elastic.co/elasticsearch/elasticsearch:7.2.0
        resources:
            limits:
              cpu: 1000m
            requests:
              cpu: 10m
        ports:
        - containerPort: 9200
          name: rest
          protocol: TCP
        - containerPort: 9300
          name: inter-node
          protocol: TCP
        volumeMounts:
        - name: data
          mountPath: /usr/share/elasticsearch/data
        env:
          - name: discovery.type
            value: single-node
          - name: cluster.name
            value: k8s-logs
          - name: node.name
            valueFrom:
              fieldRef:
                fieldPath: metadata.name
          - name: discovery.seed_hosts
            value: "es-cluster-0.elasticsearch"
          - name: ES_JAVA_OPTS
            value: "-Xms512m -Xmx512m"
      initContainers:
      - name: fix-permissions
        image: busybox
        command: ["sh", "-c", "chown -R 1000:1000 /usr/share/elasticsearch/data"]
        securityContext:
          privileged: true
        volumeMounts:
        - name: data
          mountPath: /usr/share/elasticsearch/data
      - name: increase-vm-max-map
        image: busybox
        command: ["sysctl", "-w", "vm.max_map_count=262144"]
        securityContext:
          privileged: true
      - name: increase-fd-ulimit
        image: busybox
        command: ["sh", "-c", "ulimit -n 65536"]
        securityContext:
          privileged: true
  volumeClaimTemplates:
  - metadata:
      name: data
      labels:
        app: elasticsearch
    spec:
      accessModes: [ "ReadWriteOnce" ]
      resources:
        requests:
          storage: 5Gi
Now, make sure your Elasticsearch pod is up and running:
[root@mr-k8s-demo1 ~]# kubectl get pods -l app=elasticsearch
NAME           READY   STATUS    RESTARTS        AGE
es-cluster-0   1/1     Running   2 (2d16h ago)   5d13h
Time to run a test call via HTTP. Here we have 2 alternatives.
Option #1:
Forward traffic to port 9200 and test via curl from the Linux host VM:
[root@mr-k8s-demo1 ~]# kubectl port-forward $(kubectl get pods -o=name --selector=app=elasticsearch) 9200:9200Open a new shell (port-forward will allocate the shell above)
[root@mr-k8s-demo1 ~]# curl http://localhost:9200/_cluster/state?prettyOption #2:
Expose permanently port 9200 with a Service so that it becomes accessible outside from the cluster as well (using Linux host VM’s real IP address):
[root@mr-k8s-demo1 ~]# kubectl expose service elasticsearch --port=9200 --target-port=9200 --external-ip=external_ip_of_your_Linux_host_VM --name=elasticsearch-externalOpen a browser and go to http://external_ip_of_your_Linux_host_VM:9200/_cluster/state?pretty
That’s it, regarding Elasticsearch.
Step 2: Kibana deployment
Deploy service + deployment using the following manifest:
apiVersion: v1
kind: Service
metadata:
  name: kibana
  namespace: default
  labels:
    app: kibana
spec:
  ports:
  - port: 5601
  selector:
    app: kibana
---
apiVersion: apps/v1
kind: Deployment
metadata:
  name: kibana
  namespace: default
  labels:
    app: kibana
spec:
  replicas: 1
  selector:
    matchLabels:
      app: kibana
  template:
    metadata:
      labels:
        app: kibana
    spec:
      containers:
      - name: kibana
        image: docker.elastic.co/kibana/kibana:7.2.0
        resources:
          limits:
            cpu: 1000m
          requests:
            cpu: 10m
        env:
          - name: ELASTICSEARCH_URL
            value: http://elasticsearch:9200
        ports:
        - containerPort: 5601
Testing Kibana availability
Now, similarly to what we have just done with Elasticsearch, we must expose our Service. This time, since you will be frequently accessing the web UI, suggested solution is to create directly a Service to expose port 5601:
[root@mr-k8s-demo1 ~]# kubectl expose service kibana --port=5601 --target-port=5601 --external-ip=external_ip_of_your_Linux_host_VM --name=kibana-externalAnd point your browser to http://external_ip_of_your_Linux_host_VM:5601
Step 3: Fluentd deployment
Next we will set up set up Fluentd as a DaemonSet. Because it is DaemonSet, a Fluentd logging agent Pod will run on every node in our cluster.
Use the following yaml to create the Fluentd daemonset. It will do the following:
- Create a ServiceAccount called fluentd. Fluentd processes will use this service account to access the Kubernetes API.
- Create a ClusterRole which will allow get/list/watch access on pods.
- Create a ClusterRoleBinding. This will bind ServiceAccount above with the ClusterRole giving permissions to the ServiceAccount
apiVersion: v1
kind: ConfigMap
metadata:
  name: fluentd-config
data:
  fluent.conf: |
    <source>
      @type tail
      read_from_head true
      path /var/log/containers/nginx*.log
      pos_file /var/log/containers/nginx.log.pos
      tag nginx.access
      <parse>
        @type regexp
        expression /(?<docker_ts>[^ ]*) (?<docker_flag>[^ ]*) (?<docker_stdout>[^ ]*) (?<data>.*).*$/
      </parse>
    </source>
    <filter nginx.**>
      @type record_transformer
      <record>
        ${record["data"]}
      </record>
      remove_keys docker_ts,docker_flag,docker_stdout
    </filter>
    <filter nginx.**>
      @type parser
      key_name data
      format json
      reserve_data false
    </filter>
    <match nginx.**>
      @type elasticsearch
      host "#{ENV['FLUENT_ELASTICSEARCH_HOST']}"
      port "#{ENV['FLUENT_ELASTICSEARCH_PORT']}"
      user "#{ENV['FLUENT_ELASTICSEARCH_USER']}"
      password "#{ENV['FLUENT_ELASTICSEARCH_PASSWORD']}"
      index_name fluentd
      type_name fluentd
    </match>
    <match **>
      @type null
    </match>
---
apiVersion: v1
kind: ServiceAccount
metadata:
  name: fluentd
  namespace: default
  labels:
    app: fluentd
---
apiVersion: rbac.authorization.k8s.io/v1
kind: ClusterRole
metadata:
  name: fluentd
  labels:
    app: fluentd
rules:
- apiGroups:
  - ""
  resources:
  - pods
  - namespaces
  verbs:
  - get
  - list
  - watch
---
kind: ClusterRoleBinding
apiVersion: rbac.authorization.k8s.io/v1
metadata:
  name: fluentd
roleRef:
  kind: ClusterRole
  name: fluentd
  apiGroup: rbac.authorization.k8s.io
subjects:
- kind: ServiceAccount
  name: fluentd
  namespace: default
---
apiVersion: apps/v1
kind: DaemonSet
metadata:
  name: fluentd
  namespace: default
  labels:
    app: fluentd
spec:
  selector:
    matchLabels:
      app: fluentd
  template:
    metadata:
      labels:
        app: fluentd
    spec:
      serviceAccount: fluentd
      serviceAccountName: fluentd
      initContainers:
      - name: config-fluentd
        image: busybox
        imagePullPolicy: IfNotPresent
        command: ["/bin/sh","-c"]
        args:
        - cp /fluentd/etc2/fluent.conf /fluentd/etc/fluent.conf;
        volumeMounts:
        - name: config-path
          mountPath: /fluentd/etc
        - name: config-source
          mountPath: /fluentd/etc2
      containers:
      - name: fluentd
        #image: fluent/fluentd-kubernetes-daemonset:v1.4.2-debian-elasticsearch-1.1
        image: fluent/fluentd-kubernetes-daemonset:v1-debian-elasticsearch
        env:
          - name:  FLUENT_ELASTICSEARCH_HOST
            value: "elasticsearch"
          - name:  FLUENT_ELASTICSEARCH_PORT
            value: "9200"
          - name: FLUENT_ELASTICSEARCH_SCHEME
            value: "http"
          - name: FLUENTD_SYSTEMD_CONF
            value: disable
        resources:
          limits:
            memory: 512Mi
          requests:
            cpu: 25m
            memory: 200Mi
        volumeMounts:
        - name: varlog
          mountPath: /var/log
        - name: varlibdockercontainers
          mountPath: /var/lib/docker/containers
          readOnly: true
        - name: config-path
          mountPath: /fluentd/etc
      terminationGracePeriodSeconds: 30
      volumes:
      - name: config-source
        configMap:
          name: fluentd-config
          items:
            - key: fluent.conf
              path: fluent.conf
      - name: varlog
        hostPath:
          path: /var/log
      - name: varlibdockercontainers
        hostPath:
          path: /var/lib/docker/containers
      - name: config-path
        emptyDir: {}
Fluentd configuration
Fluentd mounts locally the folder in which log files containing stdout from all containers are available (/var/lib/docker/containers).
Depending on configuration defined on file /fluentd/etc/fluent.conf such content can then be forwarded to elasticsearch.
Configuration file is defined as a ConfigMap object which is then mounted during container startup.
References to elasticsearch must be passed as environment variables:
        env:
          - name:  FLUENT_ELASTICSEARCH_HOST
            value: "elasticsearch" # Make sure this name can be resolved within the cluster
          - name:  FLUENT_ELASTICSEARCH_PORT
            value: "9200"
          - name: FLUENT_ELASTICSEARCH_SCHEME
            value: "http"
Fluentd can read different sources, parse, filter, change/add/remove content etc. before to forward logs to a destination (e.g. elasticsearch).
Documentation (adapt to your desired version) is available here: https://docs.fluentd.org/v/0.12/
Sample configuration file (reads nginx logs as JSON):
    <source>
      @type tail # reads file polling for new entries
      read_from_head true # starts reading from beginning of the file
      path /var/log/containers/nginx*.log #pathname (can include wildcards) of file to be read
      pos_file /var/log/containers/nginx.log.pos # fluentd will store the last read position on this file
      tag nginx.access # adds a tag to this file, useful to add further steps during file processing
	  <parse>
        @type regexp # parses retrieved lines splitting the content according to the regexp below
        expression /(?<docker_ts>[^ ]*) (?<docker_flag>[^ ]*) (?<docker_stdout>[^ ]*) (?<data>.*).*$/
      </parse>
    </source>
    <filter nginx.**>
      @type record_transformer #transforms the content of entries tagged with nginx.*
      <record>
        ${record["data"]} # defines output: Field with name "data"
      </record>
      remove_keys docker_ts,docker_flag,docker_stdout # suppresses entries from output
    </filter>
    <filter nginx.**>
      @type parser
      key_name data # parses as json the value of field "data"
      format json
      reserve_data false # outputs only the parsed content ("data" root is removed)
    </filter>
    <match nginx.**>
      @type elasticsearch # sends processed entries to elasticsearch
      host "#{ENV['FLUENT_ELASTICSEARCH_HOST']}"
      port "#{ENV['FLUENT_ELASTICSEARCH_PORT']}"
      user "#{ENV['FLUENT_ELASTICSEARCH_USER']}"
      password "#{ENV['FLUENT_ELASTICSEARCH_PASSWORD']}"
      index_name fluentd # defines name of index that will be created on elasticsearch
      type_name fluentd
    </match>
    <match **>
      @type null # all the rest, not tagged as nginx.*, will be trashed
    </match>
Tips
Output can also be redirected to a file, useful for troubleshooting (you can see the outcome of log processing, based on your filters/transformers).
Sample:
    <match **>
      @type file
      path /var/log/fluent/myapp
      utc
      append true
    </match>
Sample container: Nginx
The following yaml manifest deploys an nginx instance with all default settings except for the log format: We will be using JSON.
apiVersion: v1
kind: ConfigMap
metadata:
name: nginx-conf
data:
nginx.conf: |
user nginx;
worker_processes 1;
events {
worker_connections 10240;
}
http {
log_format logger-json escape=json '{"time_local":"$time_iso8601", "remote_addr":"$remote_addr", "remote_user":"$remote_user", "request":"$request", "status":"$status", "body_bytes_sent":"$body_bytes_sent", "request_time":"$request_time", "http_referrer":"$http_referer", "http_user_agent":"$http_user_agent", "request_length":"$request_length" }';
server {
listen 80;
server_name localhost;
location / {
root /usr/share/nginx/html;
index index.html index.htm;
}
access_log /var/log/nginx/access.log logger-json;
}
}
---
apiVersion: apps/v1
kind: Deployment
metadata:
name: nginx
spec:
selector:
matchLabels:
app: nginx
replicas: 1
template:
metadata:
labels:
app: nginx
spec:
containers:
- name: nginx
image: nginx
ports:
- containerPort: 80
volumeMounts:
- name: nginx-conf
mountPath: /etc/nginx/nginx.conf
subPath: nginx.conf
readOnly: true
volumes:
- name: nginx-conf
configMap:
name: nginx-conf
items:
- key: nginx.conf
path: nginx.conf
---
apiVersion: v1
kind: Service
metadata:
name: nginx
spec:
type: NodePort
ports:
- port: 80
protocol: TCP
targetPort: 80
nodePort: 30008
selector:
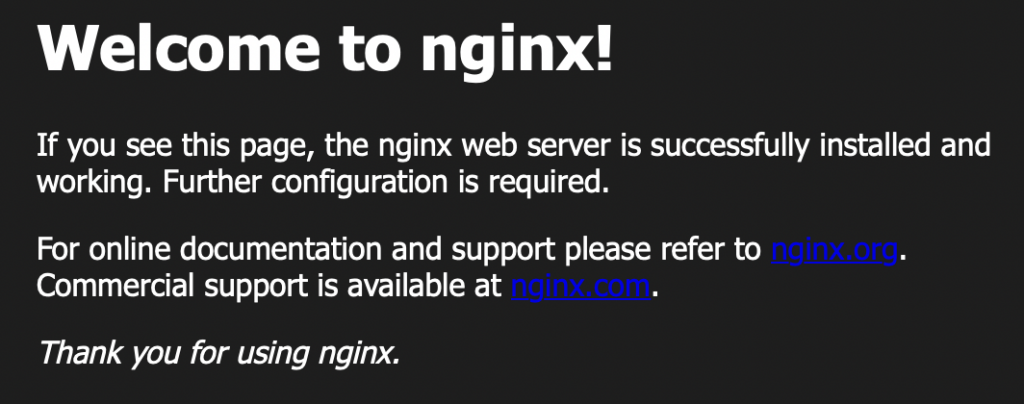
app: nginxCall your nginx just deployed pointing your browser to: http://external_ip_of_your_Linux_host_VM:30008
You should see Nginx’s home page:
Testing the complete stack
Based on the configuration provided above, nginx will log to stdout using JSON format.
Fluentd is listening on such log file, and each new line will be parsed as per configuration file and all entries matching the filter provided will be forwarded to Elasticsearch.
To make them visible, there is still a last step to complete on Kibana.
Log in to the web UI and go to Management -> Index Management:
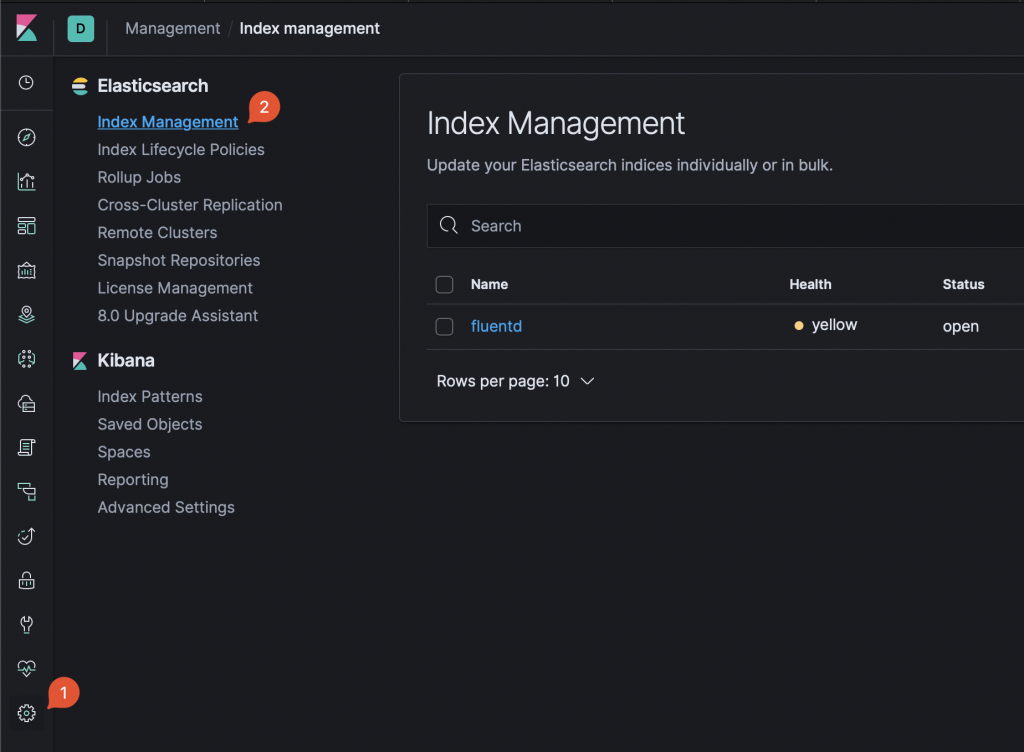
Based on the configurations provided, you should see at least 1 index named “fluentd”. Note that the name is part of Fluentd configuration file.
To make the index visible, you need to define an Index Pattern.
Click on Management -> Index Patterns -> Create Index Pattern:
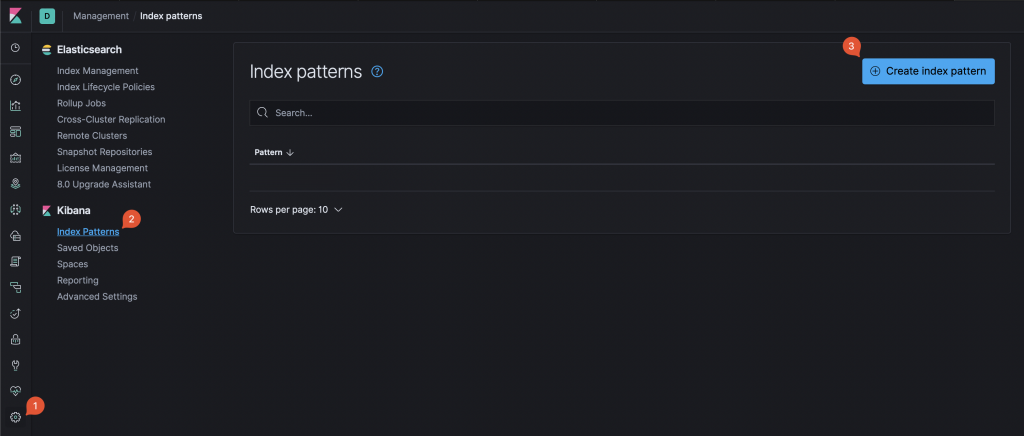
Start typing the name so that it matches at least one of existing indexes (on sample above: fluent …). Then, click next and complete index pattern creation.
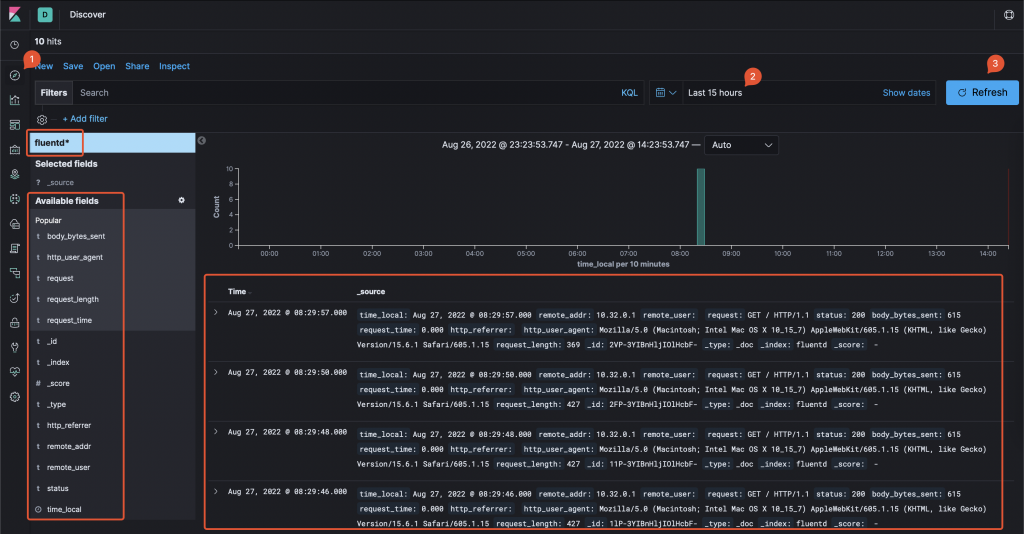
Now, click on Discover, make sure that the index pattern created above is selected, select a time range that includes the moment you accessed Nginx home page. Collected logs data will be displayed and, on the left column, each single log attribute (obtained by parsing the JSON entries) will be available.