kube-proxy explained
Table of Contents
Intro
kube-proxy is a cluster component responsible for network traffic routing. Because of that, 1 instance is running on each cluster node.
It is responsible for routing traffic between cluster components but also for traffic incoming from outside the cluster.
It essentially implements rules part of Service(s). A Service represents a rule which is then implemented by kube-proxy.
kube-proxy operating modes
kube-proxy can implement network traffic rules 3 different ways:
- iptables (default)
- userspace (old, deprecated)
- IPVS (IP Virtual Server)
This page focuses on iptables mode.
kube-proxy – iptables mode
By using iptables mode, whenever a Service is created, related iptables rules are created on each node by kube-proxy.
Such rules are part of PREROUTING chain: This means that traffic is forwarded as soon as it gets into the kernel.
Listing all iptables PREROUTING chains
sudo iptables -t nat -L PREROUTING | column -t
Example:
root@test:~# sudo iptables -t nat -L PREROUTING | column -t
Chain            PREROUTING  (policy  ACCEPT)
target           prot        opt      source    destination
cali-PREROUTING  all         --       anywhere  anywhere     /*        cali:6gwbT8clXdHdC1b1  */
KUBE-SERVICES    all         --       anywhere  anywhere     /*        kubernetes             service   portals  */
DOCKER           all         --       anywhere  anywhere     ADDRTYPE  match                  dst-type  LOCAL
Listing all rules part of a given chain
sudo iptables -t nat -L KUBE-SERVICES -n | column -t
For a better understanding, let’s consider the following example:
A new NodePort Service has been created with the following command:
kubectl expose deployment prometheus-grafana --type=NodePort --name=grafana-example-service -n monitoring
By executing the command above, a new Service got created:
[test@test ~]$ kubectl get svc/grafana-example-service -n monitoring
NAME                      TYPE       CLUSTER-IP       EXTERNAL-IP   PORT(S)          AGE
grafana-example-service   NodePort   10.111.189.177   <none>        3000:31577/TCP   100m
We did not specify any specific node port, therefore a random one between 30000 and 32767 has been automatically assigned: 31577.
Yaml manifest of Service object created with the command above:
kind: Service
metadata:
  labels:
    app.kubernetes.io/instance: prometheus
    app.kubernetes.io/managed-by: Helm
    app.kubernetes.io/name: grafana
    app.kubernetes.io/version: 9.2.4
    helm.sh/chart: grafana-6.43.5
  name: grafana-example-service
  namespace: monitoring
spec:
  clusterIP: 10.111.189.177
  clusterIPs:
  - 10.111.189.177
  externalTrafficPolicy: Cluster
  internalTrafficPolicy: Cluster
  ipFamilies:
  - IPv4
  ipFamilyPolicy: SingleStack
  ports:
  - nodePort: 31577
    port: 3000
    protocol: TCP
    targetPort: 3000
  selector:
    app.kubernetes.io/instance: prometheus
    app.kubernetes.io/name: grafana
  sessionAffinity: None
  type: NodePort
Assigning a custom nodePort
If you want to expose the Service on a custom node port, patch/edit the Service object by changing value of spec.ports.nodePort
Once the Service got created, we were able to reach grafana with the following URL: http://<NODE_IP_ADDRESS>:31577
This is made possible by kube-proxy
When Service grafana-example-service got created, kube-proxy has actually created iptables rules within KUBE_SERVICES chain which belongs to PREROUTING group, as well as a chain which collects all rules related to all NodePorts services:
sudo iptables -t nat -L KUBE-SERVICES -n  | column -t
Chain                      KUBE-SERVICES  (2   references)
target                     prot           opt  source       destination
KUBE-SVC-MDD5UT6CKUVXRUP3  tcp            --   0.0.0.0/0    10.98.226.44    /*  loki/loki-write:http-metrics                                      cluster   IP          */     tcp   dpt:3100
KUBE-SVC-FJOCBQUA67AJTJ4Y  tcp            --   0.0.0.0/0    10.103.120.150  /*  loki/loki-read:grpc                                               cluster   IP          */     tcp   dpt:9095
KUBE-SVC-GWDJ4KONO5OOHRT4  tcp            --   0.0.0.0/0    10.106.191.67   /*  loki/loki-gateway:http                                            cluster   IP          */     tcp   dpt:80
KUBE-SVC-XBIRSKPJDNCMT43V  tcp            --   0.0.0.0/0    10.111.129.177  /*  metallb-system/webhook-service                                    cluster   IP          */     tcp   dpt:443
KUBE-SVC-UZFDVIVO2N6QXLRQ  tcp            --   0.0.0.0/0    10.103.243.43   /*  monitoring/prometheus-kube-prometheus-operator:https              cluster   IP          */     tcp   dpt:443
KUBE-SVC-L5JLFDCUFDUOSAFE  tcp            --   0.0.0.0/0    10.96.126.22    /*  monitoring/prometheus-grafana:http-web                            cluster   IP          */     tcp   dpt:80
KUBE-SVC-NPX46M4PTMTKRN6Y  tcp            --   0.0.0.0/0    10.96.0.1       /*  default/kubernetes:https                                          cluster   IP          */     tcp   dpt:443
KUBE-SVC-OIUYAK75OI4PJHUN  tcp            --   0.0.0.0/0    10.111.189.177  /*  monitoring/grafana-example-service                                cluster   IP          */     tcp   dpt:3000
KUBE-SVC-FP56U3IB7O2NDDFT  tcp            --   0.0.0.0/0    10.108.50.82    /*  monitoring/prometheus-kube-prometheus-alertmanager:http-web       cluster   IP          */     tcp   dpt:9093
KUBE-SVC-TCOU7JCQXEZGVUNU  udp            --   0.0.0.0/0    10.96.0.10      /*  kube-system/kube-dns:dns                                          cluster   IP          */     udp   dpt:53
KUBE-SVC-JD5MR3NA4I4DYORP  tcp            --   0.0.0.0/0    10.96.0.10      /*  kube-system/kube-dns:metrics                                      cluster   IP          */     tcp   dpt:9153
KUBE-NODEPORTS             all            --   0.0.0.0/0    0.0.0.0/0       /*  kubernetes                                                        service   nodeports;
iptables applies all rules subsequently.
Rules must be interpreted like this:
- target: What to do whenever a given packet is matching all entry conditions (can be another rule or an action)
- prot: The protocol
- source: Source IP address of packet
- destination: Destination IP address of packet
- dpt: Destination port of packet
Example:
Consider the following rule:
target                     prot           opt  source       destination
KUBE-SVC-OIUYAK75OI4PJHUN  tcp            --   0.0.0.0/0    10.111.189.177  /*  monitoring/grafana-example-service                                cluster   IP          */     tcp   dpt:3000
Interpreting the rule
IF transmission protocol = tcp AND
whatever source IP address (0.0.0.0/0 = ANY) AND
destination IP address is 10.111.189.177 AND
destination port is 3000
THEN
apply rule KUBE-SVC-OIUYAK75OI4PJHUN
Moving on with our sample Service, when it got created, the 2 following rules have been instantiated by kube-proxy:
Chain                      KUBE-SERVICES  (2   references)
target                     prot           opt  source       destination
KUBE-SVC-OIUYAK75OI4PJHUN  tcp            --   0.0.0.0/0    10.111.189.177  /*  monitoring/grafana-example-service                                cluster   IP          */     tcp   dpt:3000
KUBE-NODEPORTS             all            --   0.0.0.0/0    0.0.0.0/0       /*  kubernetes                                                        service   nodeports;
1st rule listed above consists of the following items:
[test@test~]$ sudo iptables -t nat -L KUBE-SVC-OIUYAK75OI4PJHUN -n  | column -t
Chain                      KUBE-SVC-OIUYAK75OI4PJHUN  (2   references)
target                     prot                       opt  source          destination
KUBE-MARK-MASQ             tcp                        --   !10.244.0.0/16  10.111.189.177  /*  monitoring/grafana-example-service  cluster  IP                 */  tcp  dpt:3000
KUBE-SEP-LAT64KIID4KEQMCP  all                        --   0.0.0.0/0       0.0.0.0/0       /*  monitoring/grafana-example-service  ->       10.244.0.115:3000  */
1st item (KUBE-MARK-MASQ) marks the TCP packed as “must go through IP masquerading” whenever the source IP address does NOT belong to 10.244.0.0/16 (in short words, whenever it is not internal traffic among cluster Pods part of the current node) AND if destination address is 10.111.189.177 AND if destination port is 3000.
Then, rule KUBE-SEP-LAT64KIID4KEQMCP is applied.
Rule KUBE-SEP-LAT64KIID4KEQMCP consists of the following items:
[test@test ~]$ sudo iptables -t nat -L KUBE-SEP-LAT64KIID4KEQMCP -n  | column -t
Chain           KUBE-SEP-LAT64KIID4KEQMCP  (1   references)
target          prot                       opt  source        destination
KUBE-MARK-MASQ  all                        --   10.244.0.115  0.0.0.0/0    /*  monitoring/grafana-example-service  */
DNAT            tcp                        --   0.0.0.0/0     0.0.0.0/0    /*  monitoring/grafana-example-service  */  tcp  to:10.244.0.115:3000
Which means:
IF source address is 10.244.0.115, regardless of the destination IP address, mark packet as to go through IP masquerading.
THEN, execute DNAT (Destination Network Address Translation) and forward it to 10.244.0.115:3000
Traffic from source IP addresses which do NOT belong to cluster internal network would indeed get discarded, that explains why IP masquerading is required in this case.
Whenever the 1st rule is not matching, which means that the source IP address already belongs to internal cluster network, no IP masquerading is required, and in this case the 2nd rule above will be applied (rule KUBE-SEP-LAT64KIID4KEQMCP).
This rule simply forwards the packet to 10.244.0.155:3000 which relates to grafana Pod’s IP address:
[test@test ~]$ kubectl describe pods/prometheus-grafana-5f848c4987-btg95 -n monitoring
Name:             prometheus-grafana-5f848c4987-btg95
Namespace:        monitoring
Priority:         0
Service Account:  prometheus-grafana
Node:             cc-sauron/172.25.50.60
Start Time:       Wed, 16 Nov 2022 15:10:34 +0100
Labels:           app.kubernetes.io/instance=prometheus
                  app.kubernetes.io/name=grafana
                  pod-template-hash=5f848c4987
Annotations:      checksum/config: b9e953e845ac788d3c1ac8894062e8234ed2fd5b5ca91d5908976c4daf5c4bb8
                  checksum/dashboards-json-config: 01ba4719c80b6fe911b091a7c05124b64eeece964e09c058ef8f9805daca546b
                  checksum/sc-dashboard-provider-config: fbdb192757901cdc4f977c611f5a1dceb959a1aa2df9f92542a0c410ce3be49d
                  checksum/secret: 12768ec288da87f3603cb2ca6c39ebc1ce1c2f42e0cee3d9908ba1463576782a
Status:           Running
IP:               10.244.0.115
The traffic therefore eventually reaches the Pod either by going through IP masquerading (re-mapping source IP address) or directly, depending on the initial source IP address.
Because of such rule, whenever a client connects to http://<NODE_IP_ADDRESS>:31577 even though there are no LISTENING sockets on the node, traffic is forwarded to the grafana Pod.
Should any process open a socket and bind it to the same port (31577, in this case), the Pod would still receive all traffic directed to that port since iptables rules are applied as soon as the packet reaches the kernel.
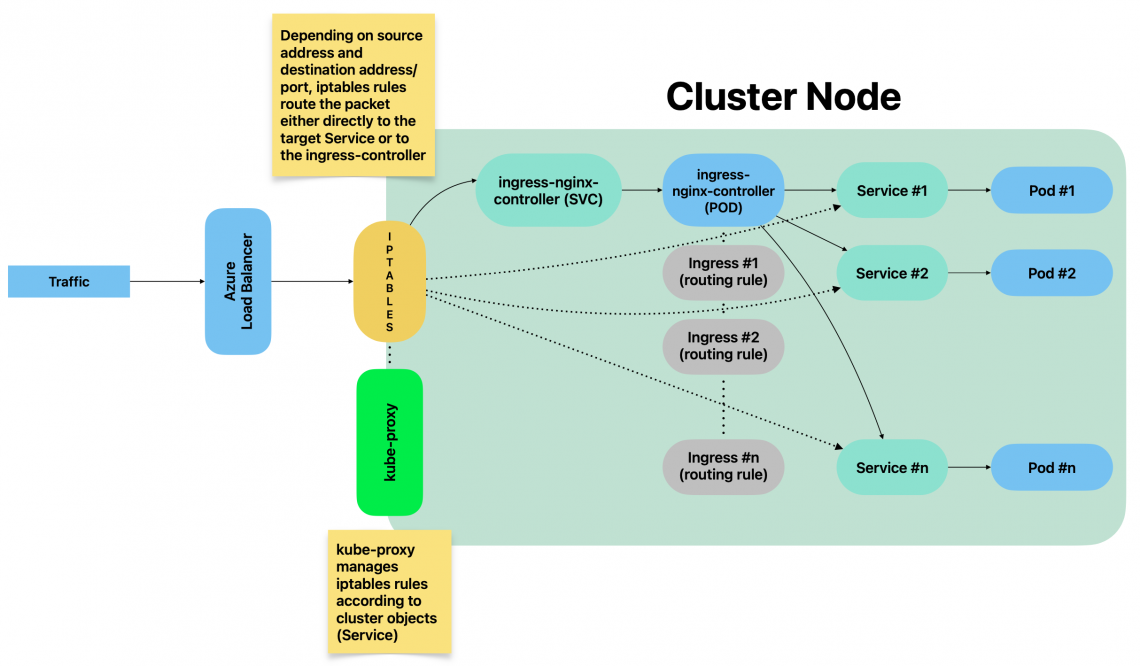
We can summarise the traffic flow – from external systems – like this:
External references
The following pages helped a lot:
- https://medium.com/google-cloud/kubernetes-nodeport-vs-loadbalancer-vs-ingress-when-should-i-use-what-922f010849e0
- https://www.learnsteps.com/how-exactly-kube-proxy-works-basics-on-kubernetes/
- https://www.cyberciti.biz/faq/howto-iptables-show-nat-rules/
- https://ronaknathani.com/blog/2020/07/kubernetes-nodeport-and-iptables-rules/