DevSecOps
-
How to expose kubernetes api-server metrics
Kubernetes api-server provides very interesting metrics which could make a difference when it comes to detecting potential security threats.
Accessing api-server requires a Token and a certificate. Both must be related to a ServiceAccount with sufficient permissions to access metrics endpoint. This post describes how to achieve such setup.
Namespace
Before to start, make sure your current context is using “default” namespacekubectl config set-context --current --namespace=default
Step 1: Create a new ServiceAccount
kubectl create serviceaccount metrics-explorer
Step 2: Create a new ClusterRole with sufficient permissions to access api-server metrics endpoint via HTTP GET
kind: ClusterRole
apiVersion: rbac.authorization.k8s.io/v1
metadata:
  name: metrics-explorer
rules:
- nonResourceURLs:
  - /metrics
  - /metrics/cadvisor
  verbs:
  - get
Step 3: Create new ClusterRoleBinding to bind the ServiceAccount with ClusterRole
kubectl create clusterrolebinding metrics-explorer:metrics-explorer --clusterrole metrics-explorer --serviceaccount default:metrics-explorer
Step 4: Export ServiceAccount’s token Secret’s name
SERVICE_ACCOUNT=metrics-explorer
SECRET=$(kubectl get serviceaccount ${SERVICE_ACCOUNT} -o json | jq -Mr '.secrets[].name | select(contains("token"))')
Step 5: Extract Bearer token from Secret and decode it
TOKEN=$(kubectl get secret ${SECRET} -o json | jq -Mr '.data.token' | base64 -d)Step 6: Extract, decode and write the ca.crt to a temporary location
kubectl get secret ${SECRET} -o json | jq -Mr '.data["ca.crt"]' | base64 -d > /tmp/ca.crtFinal step: Test access to metrics endpoint
curl -s <API-SERVER>/metrics --header "Authorization: Bearer $TOKEN" --cacert /tmp/ca.crt | less
Configuring as additional scrape target on Prometheus
Transfer the certificate file from api-server’s VM to Prometheus’ VM. (e.g. destination filename: /opt/api-server-files/ca.crt)
Save the TOKEN obtained on steps above to a file on Prometheus’ VM. (e.g. destination filename: /opt/api-server-files/api-server-token)
Edit Prometheus main configuration file (e.g. /etc/prometheus/prometheus.yml) and add the following scrape target:
- bearer_token_file: /opt/api-server-files/api-server-token job_name: kubernetes-apiservers static_configs: - targets: ['<API-SERVER-IP>:6443'] metrics_path: '/metrics' scheme: https tls_config: ca_file: /opt/api-server-files/ca.crt -
Cloud Security – Curiefense deployment and configuration
Table of Contents
Intro
Curiefense is an open source project managed by Reblaze (see https://www.reblaze.com/).
It adds a security layer on top of your existing stack by scanning inbound network traffic.
It comes with a set of pre-configured rules out of the box which cover most of the known threats.
Full product documentation is available here: https://docs.curiefense.io/
Overview
Curiefense stack is made up of several components:
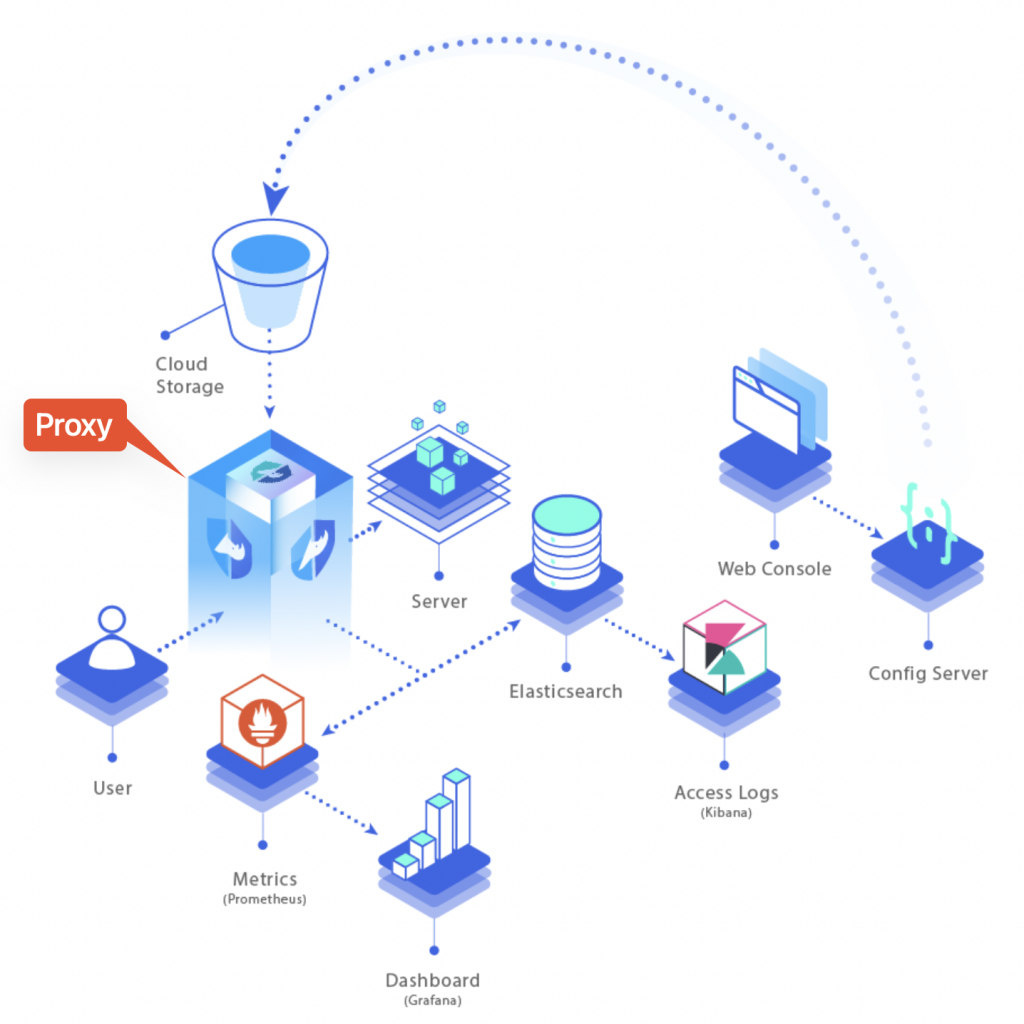
Curiefense full stack overview As viewable from the overview diagram above, all the incoming traffic has to go through the proxy. That’s where all rules are applied and traffic gets monitored and filtered, before to be routed to its final destination (the server).
Each inbound request gets logged and becomes part of metrics (data is stored into a mongoDB and Prometheus instance) and traffic logs (stored into Elasticsearch).
Metrics can then be exposed to Grafana and traffic logs become available either on Kibana or Grafana as well (by adding an extra data source, referring to Elasticsearch).
Rules that determine whether incoming traffic is eligible to be accepted/rejected or just tagged for future analysis are accessible through the Config Server (data is stored into a Redis instance).
Deploying as NGINX-Ingress
Official documentation provides instructions to deploy curiefense on top of an existing kubernetes cluster so that it gets attached to the ingress-controller (nginx).
Official how-to guide is available here: https://docs.curiefense.io/installation/deployment-first-steps/nginx-ingress
The steps included on the official guide linked above include the Config Server, the corresponding redis data store, but do NOT include all the other components (proxy, prometheus, mongodb, elasticsearch, grafana, kibana).
Step-by-step guide
- Create a new namespace:
kubectl create namespace curiefense
- In case you need to use a local bucket (rather than storage hosted on some cloud provider):
- create file secret.yaml with following content:
export CURIE_BUCKET_LINK=file:///u01/curiefense/prod/manifest.json
- Create a Secret:
kubectl create secret generic curiesync --from-file=secret.yaml --dry-run=client -o yaml > curiesync-secret.yaml
kubectl apply -f curiesync-secret.yaml -n curiefense
- Create file values.ingress.yaml with following content:
controller: image: repository: curiefense/curiefense-nginx-ingress tag: e2bd0d43d9ecd7c6544a8457cf74ef1df85547c2 volumes: - name: curiesync secret: secretName: curiesync volumeMounts: - name: curiesync mountPath: /etc/curiefense- Install the helm chart:
helm repo add nginx-stable https://helm.nginx.com/stable
helm repo update
helm -n curiefense install --version 0.11.1 -f values.ingress.yaml ingress nginx-stable/nginx-ingress
(wrt version to use, see https://github.com/nginxinc/kubernetes-ingress/releases/tag/v2.0.1)
- Create a file s3cfg-secret.yaml with the following content (dummy secret values since we are not using a s3 bucket but this secret is required to start up the application):
apiVersion: v1 kind: Secret metadata: name: s3cfg namespace: curiefense type: Opaque stringData: s3cfg: | [default] access_key = test secret_key = test- Create the secret:
kubectl -n curiefense apply -f s3cfg-secret.yaml
- Create a file values.curiefense.yaml with the following content:
global: proxy: frontend: "nginx" settings: curieconf_manifest_url: "file:///u01/curiefense/prod/manifest.json"- Clone and install the git repo:
git clone https://github.com/curiefense/curiefense-helm.git
helm install -n curiefense -f values.curiefense.yaml curiefense ./curiefense-helm/curiefense-helm/curiefense
- Expose the Config Server web UI to make it accessible via browser:
kubectl expose service uiserver -n curiefense --port=8088 --target-port=80 --external-ip=172.25.50.44 --name=uiserver-external
Deploying with docker-compose
In this case, the deployment instructions include all the items listed on the overview diagram above.
Official how-to deployment guide: https://docs.curiefense.io/installation/deployment-first-steps/docker-compose
Application components URLs
- Config Server web UI: http://YOUR_SERVER_IP:30080 (no authentication required by default)
- Grafana: http://YOUR_SERVER_IP:30300 (admin / admin)
Adding Elasticsearch data source on Grafana
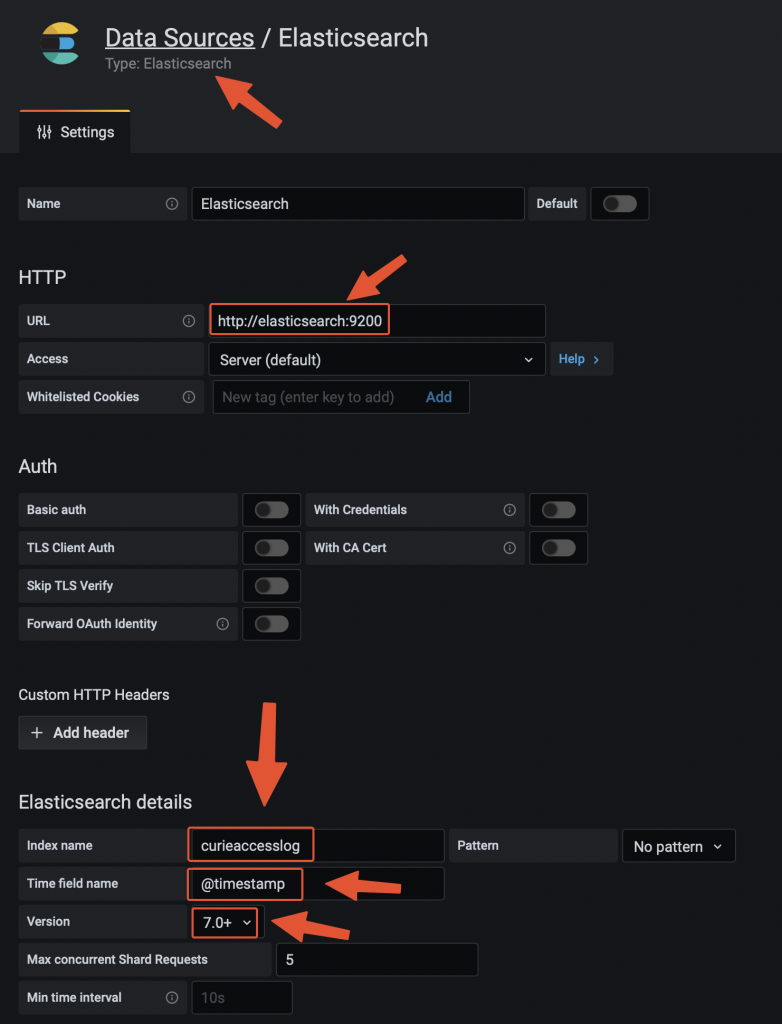
Adding the data source on Grafana Testing the traffic filtering rules
The deployment instructions linked above include a test echoserver to which we can address a malicious request and see how curiefense reacts to that.
One of the pre-defines rules relates to SQL injections attacks.
We can simulate the request via curl from the server itself:
curl -vvv 'http://localhost:30081/?username=%22delete%20from%20a%22'

Response:
*   Trying ::1:30081...
* Connected to localhost (::1) port 30081 (#0)
> GET /?username=%22delete%20from%20a%22 HTTP/1.1
> Host: localhost:30081
> User-Agent: curl/7.76.1
> Accept: */*
>
* Mark bundle as not supporting multiuse
< HTTP/1.1 473 Unknown
< content-length: 13
< content-type: text/plain
< date: Wed, 21 Dec 2022 09:14:19 GMT
< server: envoy
<
* Connection #0 to host localhost left intact
access denied
Request has been blocked with a HTTP 473 and error message “access denied”.
Response codes and messages can be customised through the Config Server UI:
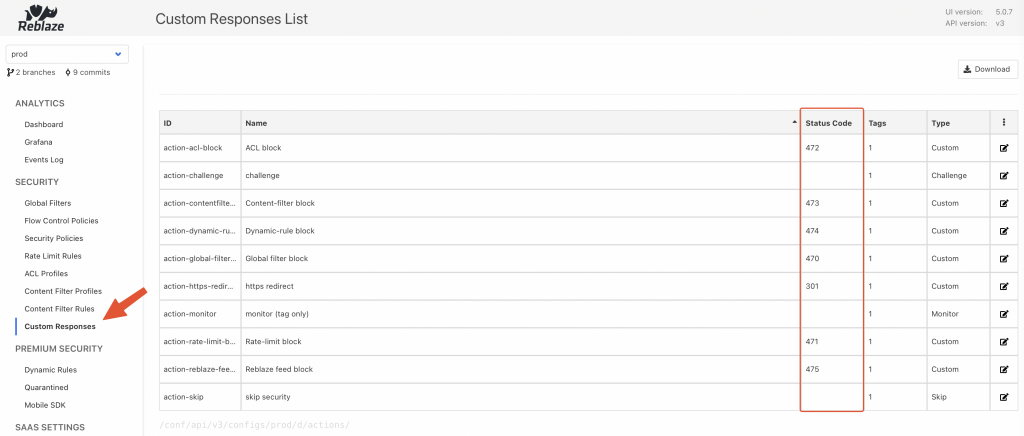
Curiefense config server UI 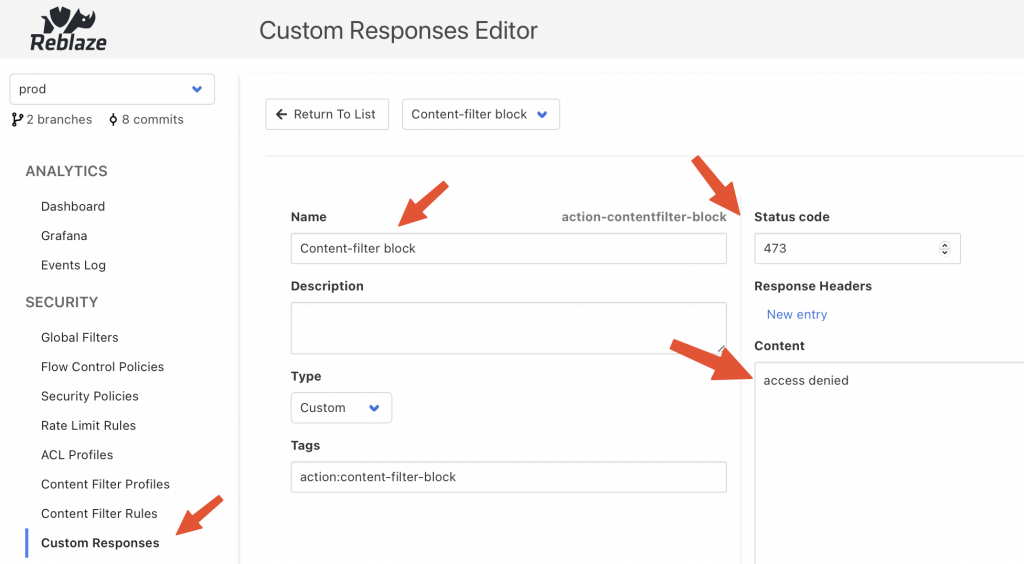
Curiefense content filter rule The request has been logged on Elasticsearch with the following JSON entry:
{
    "_id": "9VT2M4UBh8jqMva1ar--",
    "_type": "_doc",
    "_index": "curieaccesslog-2022.12.20-000001",
    "sort": [
        1671614064340,
        17
    ],
    "@timestamp": "2022-12-21T09:14:24.340Z",
    "global_filter_triggers": [
        {
            "id": "3c266a476d1e",
            "name": "test",
            "active": false
        }
    ],
    "response_code": 473,
    "logs": [
        "D 0µs Inspection init",
        "D 22µs Inspection starts (grasshopper active: true)",
        "D 38µs CFGLOAD logs start",
        "D 1258µs Loading configuration from /cf-config/current/config",
        "D 1645580µs Loaded profile __defaultcontentfilter__ with 188 rules",
        "D 40µs CFGLOAD logs end",
        "D 41µs Selected hostmap default security policy",
        "D 92µs Selected hostmap entry __root_entry__",
        "D 94µs map_request starts",
        "D 110µs headers mapped",
        "D 118µs geoip computed",
        "D 123µs uri parsed",
        "D 123µs no body to parse",
        "D 124µs args mapped",
        "D 198µs challenge phase2 ignored",
        "D 198µs Global filter decision [BlockReason { initiator: GlobalFilter { id: \"3c266a476d1e\", name: \"test\" }, location: Request, extra_locations: [], decision: Monitor, extra: Null }]",
        "D 216µs limit checks done",
        "D 222µs ACL result: bot(none)/human(none)",
        "D 503µs matching content filter signatures: true",
        "D 515µs signature matched [0..15] ContentFilterRule { id: \"100007\", operand: \"(\\\"|'|\\\\s|;)delete\\\\s+from\\\\s+.+(--|'|\\\"|;)\", risk: 5, category: \"sqli\", subcategory: \"statement injection\", tags: {\"rtc:injection\"} }",
        "D 545µs Content Filter checks done"
    ],
    "profiling": [
        {
            "name": "secpol",
            "value": 93
        },
        {
            "name": "mapping",
            "value": 184
        },
        {
            "name": "flow",
            "value": 209
        },
        {
            "value": 216,
            "name": "limit"
        },
        {
            "name": "acl",
            "value": 223
        },
        {
            "value": 544,
            "name": "content_filter"
        }
    ],
    "content_filter_triggers": [
        {
            "id": "100007",
            "risk_level": 5,
            "value": "\"delete from a\"",
            "name": "username",
            "request_element": "uri",
            "active": true
        }
    ],
    "log": {
        "offset": 0,
        "file": {
            "path": ""
        }
    },
    "proxy": [
        {
            "name": "geo_long"
        },
        {
            "name": "geo_lat"
        },
        {
            "name": "container",
            "value": "curieproxyenvoy"
        }
    ],
    "authority": "localhost:30081",
    "reason": "blocking - content filter 100007[lvl5] - [URI argument username=\"delete from a\"]",
    "headers": [
        {
            "name": "x-envoy-internal",
            "value": "true"
        },
        {
            "value": "3b962173-5af0-4c21-b7af-f7b631148f82",
            "name": "x-request-id"
        },
        {
            "value": "curl/7.76.1",
            "name": "user-agent"
        },
        {
            "name": "accept",
            "value": "*/*"
        },
        {
            "name": "x-forwarded-for",
            "value": "172.18.0.1"
        },
        {
            "value": "https",
            "name": "x-forwarded-proto"
        }
    ],
    "ip": "172.18.0.1",
    "uri": "/?username=%22delete%20from%20a%22",
    "processing_stage": 6,
    "security_config": {
        "cf_rules": 188,
        "rate_limit_rules": 4,
        "global_filters_active": 7,
        "revision": "10861a33c58a25fe433596a736d6af8803e85214",
        "acl_active": true,
        "cf_active": true
    },
    "path_parts": [
        {
            "name": "path",
            "value": "/"
        }
    ],
    "path": "/",
    "method": "GET",
    "curiesession": "ab026b48001ae1563689b0171cf7966cefc4f75524f1c3f403cfdfb7",
    "timestamp": "2022-12-21T09:14:20.243210800Z",
    "trigger_counters": {
        "content_filters_active": 1,
        "acl": 0,
        "acl_active": 0,
        "global_filters": 1,
        "global_filters_active": 0,
        "rate_limit": 0,
        "rate_limit_active": 0,
        "content_filters": 1
    },
    "acl_triggers": [],
    "ecs": {
        "version": "1.8.0"
    },
    "restriction_triggers": [],
    "arguments": [
        {
            "name": "username",
            "value": "\"delete from a\""
        }
    ],
    "rate_limit_triggers": [],
    "input": {
        "type": "stdin"
    },
    "host": {
        "name": "curieproxyenvoy"
    },
    "agent": {
        "hostname": "curieproxyenvoy",
        "ephemeral_id": "0e742beb-b416-44ad-880e-08b35c69229b",
        "id": "9fee5a67-484e-4ad9-8740-29ba9c8aa9ec",
        "name": "curieproxyenvoy",
        "type": "filebeat",
        "version": "7.13.3"
    },
    "cookies": [],
    "tags": [
        "cookies:0",
        "geo-region:nil",
        "action:content-filter-block",
        "geo-org:nil",
        "geo-city:nil",
        "cf-rule-subcategory:statement-injection",
        "cf-rule-id:100007",
        "geo-continent-code:nil",
        "action:monitor",
        "securitypolicy:default-security-policy",
        "host:localhost:30081",
        "ip:172-18-0-1",
        "all",
        "bot",
        "args:1",
        "geo-country:nil",
        "headers:6",
        "securitypolicy-entry:--root--",
        "aclid:--acldefault--",
        "aclname:acl-default",
        "contentfilterid:--defaultcontentfilter--",
        "cf-rule-category:sqli",
        "rtc:injection",
        "geo-subregion:nil",
        "contentfiltername:default-contentfilter",
        "cf-rule-risk:5",
        "geo-continent-name:nil",
        "geo-asn:nil",
        "network:nil",
        "status:473",
        "status-class:4xx"
    ],
    "curiesession_ids": []
}
Configuring as edge reverse proxy
Curiefense comes with an envoy proxy which can be used as edge proxy.
When following the deployment with docker-compose, this component is included.
There are some steps to be taken into account, when it comes to configuring as reverse proxy.
The curiefense envoy reverse proxy image is built on top of official envoy proxy image. For more details, see https://docs.curiefense.io/reference/services-container-images#curieproxy-envoy
Even though the official documentation linked above mentions 1 configuration, so that requests are proxied to 1 destination (TARGET_ADDRESS:TARGET_PORT), it actually comes pre-configured to route 2 requests toward 2 back-ends (both 443 and 80).
Standard envoy proxy (see https://www.envoyproxy.io/ ) can indeed be configured with multiple back-ends, but the docker image built on top of it by curiefense (see https://github.com/curiefense/curiefense/tree/main/curiefense/images/curieproxy-envoy ) is actually including 4 environment variables (2 for each back-end, 1 for the address and one for the port).
The docker-compose.yaml part of the repo (https://github.com/curiefense/curiefense.git) looks like this (available at https://github.com/curiefense/curiefense/tree/main/deploy/compose):
version: "3.7"
services:
  curieproxyenvoy:
    container_name: curieproxyenvoy
    hostname: curieproxyenvoy
    image: "curiefense/curieproxy-envoy:${DOCKER_TAG}"
    restart: always
    volumes:
      - curieproxy_config:/cf-config
      - ./filebeat/ilm.json:/usr/share/filebeat/ilm.json
      - ./filebeat/template.json:/usr/share/filebeat/template.json
    environment:
      - ENVOY_UID
      - TARGET_ADDRESS_A=${TARGET_ADDRESS_A:-echo}           # 1st back-end
      - TARGET_PORT_A=${TARGET_PORT_A:-8080}             # 1st back-end
      - TARGET_ADDRESS_B=${TARGET_ADDRESS_B:-juiceshop}      # 2nd back-end
      - TARGET_PORT_B=${TARGET_PORT_B:-3000}             # 2nd back-end
      - XFF_TRUSTED_HOPS
      - ENVOY_LOG_LEVEL
      - FILEBEAT
      - FILEBEAT_LOG_LEVEL
      - ELASTICSEARCH_URL=${ELASTICSEARCH_URL:-http://elasticsearch:9200}
      - KIBANA_URL=${KIBANA_URL:-http://kibana:5601}
    networks:
      curiemesh:
        aliases:
          - curieproxy
    ports:
      - "30081:80"                                           # routing traffic from host port 30081 to container port 80
      - "30082:81"                                           # routing traffic from host port 30082 to container port 81
      - "30444:443"                                          # routing traffic from host port 30444 to container port 443
      - "30445:444"                                          # routing traffic from host port 30445 to container port 444
      - "8001:8001"                                          # routing traffic from host port 8001 to container port 8001
    secrets:
      - curieproxysslcrt
      - curieproxysslkey
Environment variables referring to elastic/kibana endpoints are also listed.
The service attributes include also 2 secrets (curieproxysslcrt and curieproxysslkey): They refer to these objects, still part of same file docker-compose.yaml:
secrets:
  curieproxysslcrt:
    file: "curiesecrets/curieproxy_ssl/site.crt"
  curieproxysslkey:
    file: "curiesecrets/curieproxy_ssl/site.key"
Secrets relate to TLS certificate public and private keys that will be exposed by the reverse proxy.
The file path is relative and root folder is the same where docker-compose.yaml file is hosted (curiefense/deploy/compose where curiefense is the folder that was created when you cloned the git repo).
To configure your TLS public certificate you can either overwrite the 2 files above or change the “secrets” configuration within docker-compose.yaml
Regarding the ports to be exposed, as viewable from the code snippet above, by default 80 and 443 are not served. To expose them, the following ports configuration will do the job:
    ports:
      - "80:80"
      - "443:443"
Assuming you need just 1 back-end, the 2 remaining values to be customised relate to TARGET_ADDRESS_A and TARGET_PORT_A.
They both refer to environment variables.
Customising environment variables, when using docker-compose, can be achieved in 2 ways:
- defining their name/value within a file named .env available within the same folder of docker-compose.yaml (recommended)
- exporting the variable name/value as system-wide environment variable (e.g. export NAME=value). By doing so, you would override any value defined within .env file mentioned above.
To assign back-end IP/PORT we can therefore create/edit the file .env
TARGET_ADDRESS_A=back-end1.sample.demo
TARGET_PORT_A=443
curiefense proxy image has been re-built since, as it is, proxying over HTTPS is not working properly.
curieproxy-envoy image builds up the complete envoy.yaml configuration file (main configuration file for envoy proxy) by putting together the three following files, all available at ~/curiefense/curiefense/curieproxy
- envoy.yaml.head
- envoy.yaml.tls
- envoy.yaml.tail
Sections that needs to be adapted relate to envoy.yaml.tail:
  clusters:
  - name: target_site_a
    connect_timeout: 25s
    type: strict_dns # static
# START EXTRA SECTION 1
    transport_socket:
      name: envoy.transport_sockets.tls
      typed_config:
        "@type": type.googleapis.com/envoy.extensions.transport_sockets.tls.v3.UpstreamTlsContext
        common_tls_context:
          tls_certificates:
            - certificate_chain:
                filename: "/run/secrets/curieproxysslcrt"
              private_key:
                filename: "/run/secrets/curieproxysslkey"
          alpn_protocols: ["h2,http/1.1"]
# END EXTRA SECTION 1
    # Comment out the following line to test on v6 networks
    dns_lookup_family: V4_ONLY
    lb_policy: round_robin
# START EXTRA SECTION 2
    typed_extension_protocol_options:
      envoy.extensions.upstreams.http.v3.HttpProtocolOptions:
        "@type": type.googleapis.com/envoy.extensions.upstreams.http.v3.HttpProtocolOptions
        explicit_http_config:
          http2_protocol_options:
            initial_stream_window_size: 65536  # 64 KiB
            initial_connection_window_size: 1048576  # 1 MiB
# END EXTRA SECTION 2
    load_assignment:
      cluster_name: target_site_a
      endpoints:
      - lb_endpoints:
        - endpoint:
            address:
              socket_address:
                address: TARGET_ADDRESS_A
                port_value: TARGET_PORT_A
  - name: target_site_b
    connect_timeout: 25s
    type: strict_dns # static
    # Comment out the following line to test on v6 networks
    dns_lookup_family: V4_ONLY
    lb_policy: round_robin
    load_assignment:
      cluster_name: target_site_b
      endpoints:
      - lb_endpoints:
        - endpoint:
            address:
              socket_address:
                address: TARGET_ADDRESS_B
                port_value: TARGET_PORT_B
File envoy.yaml.tls:
  - name: tls
    address:
      socket_address:
        address: 0.0.0.0
        port_value: 443
    filter_chains:
    - filters:
      - name: envoy.filters.network.http_connection_manager
        typed_config:
          "@type": type.googleapis.com/envoy.extensions.filters.network.http_connection_manager.v3.HttpConnectionManager
          stat_prefix: ingress_http
          codec_type: auto
          use_remote_address: true
          skip_xff_append: false
          access_log:
            name: envoy.file_access_log
            typed_config:
              "@type": "type.googleapis.com/envoy.extensions.access_loggers.file.v3.FileAccessLog"
              path: /dev/stdout
              log_format:
                text_format_source:
                  inline_string: "%DYNAMIC_METADATA(com.reblaze.curiefense:request.info)%\n"
                content_type: "application/json"
          route_config:
            name: local_route
            virtual_hosts:
            - name: target_site_a
              domains: ["*"]
              routes:
              - match:
                  prefix: "/"
                route:
                  cluster: target_site_a
                metadata:
                  filter_metadata:
                    envoy.filters.http.lua:
                      xff_trusted_hops: 1
          http_filters:
          - name: envoy.filters.http.lua
            typed_config:
              "@type": type.googleapis.com/envoy.extensions.filters.http.lua.v3.Lua
              default_source_code:
                inline_string: |
                  local session = require "lua.session_envoy"
                  function envoy_on_request(handle)
                    session.inspect(handle)
                  end
                  function envoy_on_response(handle)
                    session.on_response(handle)
                  end
          - name: envoy.filters.http.router
            typed_config:
              "@type": type.googleapis.com/envoy.extensions.filters.http.router.v3.Router
      transport_socket:
        name: envoy.transport_sockets.tls
        typed_config:
          "@type": type.googleapis.com/envoy.extensions.transport_sockets.tls.v3.DownstreamTlsContext
          common_tls_context:
            tls_certificates:
            - certificate_chain:
                filename: "/run/secrets/curieproxysslcrt"
              private_key:
                filename: "/run/secrets/curieproxysslkey"
# START EXTRA SECTION
            alpn_protocols: ["h2,http/1.1"]
# END EXTRA SECTION
  - name: tlsjuice
    address:
      socket_address:
        address: 0.0.0.0
        port_value: 444
    filter_chains:
    - filters:
      - name: envoy.filters.network.http_connection_manager
        typed_config:
          "@type": type.googleapis.com/envoy.extensions.filters.network.http_connection_manager.v3.HttpConnectionManager
          stat_prefix: ingress_http
          codec_type: auto
          use_remote_address: true
          skip_xff_append: false
          access_log:
            name: "envoy.access_loggers.tcp_grpc"
            typed_config:
              "@type": type.googleapis.com/envoy.extensions.access_loggers.grpc.v3.HttpGrpcAccessLogConfig
              common_config:
                log_name: "test_GRPC_log"
                transport_api_version: "v3"
                grpc_service:
                  envoy_grpc:
                    cluster_name: grpc_log_cluster
          route_config:
            name: local_route
            virtual_hosts:
            - name: target_site_b
              domains: ["*"]
              routes:
              - match:
                  prefix: "/"
                route:
                  cluster: target_site_b
                metadata:
                  filter_metadata:
                    envoy.filters.http.lua:
                      xff_trusted_hops: 1
          http_filters:
          - name: envoy.filters.http.lua
            typed_config:
              "@type": type.googleapis.com/envoy.extensions.filters.http.lua.v3.Lua
              default_source_code:
                inline_string: |
                  local session = require "lua.session_envoy"
                  function envoy_on_request(handle)
                    session.inspect(handle)
                  end
                  function envoy_on_response(handle)
                    session.on_response(handle)
                  end
          - name: envoy.filters.http.router
            typed_config:
              "@type": type.googleapis.com/envoy.extensions.filters.http.router.v3.Router
      transport_socket:
        name: envoy.transport_sockets.tls
        typed_config:
          "@type": type.googleapis.com/envoy.extensions.transport_sockets.tls.v3.DownstreamTlsContext
          common_tls_context:
            tls_certificates:
              - certificate_chain:
                  filename: "/run/secrets/curieproxysslcrt"
                private_key:
                  filename: "/run/secrets/curieproxysslkey"
Once the 2 files listed above have been changed by adding the extra sections visible on the code snippets, you need to re-build the image.
Cd to folder curiefense/curiefense/images and you fill find the following objects:
curiefense/curiefense/images drwxrwxr-x 16 pxcs-admin pxcs-admin 4.0K Dec 24 14:35 .
drwxrwxr-x  6 pxcs-admin pxcs-admin 4.0K Dec 22 15:08 ..
-rwxrwxr-x  1 pxcs-admin pxcs-admin 3.9K Dec 23 15:46 build-docker-images.sh
drwxrwxr-x  4 pxcs-admin pxcs-admin 4.0K Dec 22 15:08 confserver
drwxrwxr-x  2 pxcs-admin pxcs-admin 4.0K Dec 22 15:08 curiefense-nginx-ingress
drwxrwxr-x  2 pxcs-admin pxcs-admin 4.0K Dec 22 15:08 curiefense-rustbuild
drwxrwxr-x  3 pxcs-admin pxcs-admin 4.0K Dec 22 15:08 curieproxy-envoy
drwxrwxr-x  3 pxcs-admin pxcs-admin 4.0K Dec 23 15:07 curieproxy-extproc
drwxrwxr-x  3 pxcs-admin pxcs-admin 4.0K Dec 22 15:08 curieproxy-istio
drwxrwxr-x  3 pxcs-admin pxcs-admin 4.0K Dec 22 15:08 curieproxy-nginx
drwxrwxr-x  3 pxcs-admin pxcs-admin 4.0K Dec 22 15:08 curiesync
drwxrwxr-x  2 pxcs-admin pxcs-admin 4.0K Dec 22 15:08 extproc
drwxrwxr-x  3 pxcs-admin pxcs-admin 4.0K Dec 22 15:08 grafana
drwxrwxr-x  2 pxcs-admin pxcs-admin 4.0K Dec 22 15:08 openresty
drwxrwxr-x  2 pxcs-admin pxcs-admin 4.0K Dec 22 15:08 prometheus
drwxrwxr-x  2 pxcs-admin pxcs-admin 4.0K Dec 22 15:08 redis
drwxrwxr-x  2 pxcs-admin pxcs-admin 4.0K Dec 22 15:08 traffic-metrics-exporter
The script build-docker-images.sh must be executed and it will look after re-building new image that will include changes you applied to envoy yaml configuration files.
As it is, the script rebuilds all images for all components part of curiefense stack. In case you need to re-build only curieproxy-envoy you will have to edit the script and comment all the rest:
#! /bin/bash

# Change directory to this script's location
cd "${0%/*}" || exit 1

# Parameters should be passed as environment variables.
# By default, builds and tags images locally, without pushing
# To push, set `PUSH=1`
# To specify a different repo, set `REPO=my.repo.tld`

REPO=${REPO:-curiefense}
BUILD_OPT=${BUILD_OPT:-}
BUILD_RUST=${BUILD_RUST:-yes}

declare -A status

GLOBALSTATUS=0

if [ -z "$DOCKER_TAG" ]
then
    GITTAG="$(git describe --tag --long --dirty)"
    DOCKER_DIR_HASH="$(git rev-parse --short=12 HEAD:curiefense)"
    DOCKER_TAG="${DOCKER_TAG:-$GITTAG-$DOCKER_DIR_HASH}"
fi

STOP_ON_FAIL=${STOP_ON_FAIL:-yes}

IFS=' ' read -ra RUST_DISTROS <<< "${RUST_DISTROS:-bionic focal}"

if [ -n "$TESTIMG" ]; then
    IMAGES=("$TESTIMG")
    OTHER_IMAGES_DOCKER_TAG="$DOCKER_TAG"
    DOCKER_TAG="test"
    echo "Building only image $TESTIMG"
else
# SECTION BELOW DEFINES WHICH IMAGES WILL BE RE_BUILT
#    IMAGES=(confserver curieproxy-istio curieproxy-envoy \
#        curieproxy-nginx curiesync grafana prometheus extproc \
#        redis traffic-metrics-exporter)
        IMAGES=(curieproxy-envoy)
fi
. . .
Once you adapted the script according to your needs, you can run it (as root).
Once the execution completes, stdout will show the version of image just built (e.g. v1.5.0-824-gc904993f-dirty-88950e011065).
Now, since we decided to re-build only this specific image and not all images for all containers, we need to define a new environment variable (to be included into .env file) and then refer the same into curiefense-envoy service part of docker-compose.yaml.
.env:
ENVOY_UID=0
DOCKER_TAG=main

# BELOW THE IMAGE VERSION TO BE USED FOR ENVOY_PROXY
DOCKER_TAG_ENVOY_PROXY="v1.5.0-824-gc904993f-dirty-88950e011065"

XFF_TRUSTED_HOPS=1
ENVOY_LOG_LEVEL=error
EXTPROC_LOG_LEVEL=info
ELASTICSEARCH="--elasticsearch http://elasticsearch:9200/"
FILEBEAT=yes
CURIE_BUCKET_LINK=file:///bucket/prod/manifest.json
docker-compose.yaml (extract):
version: "3.7"
services:

  curieproxyenvoy:
    container_name: curieproxyenvoy
    hostname: curieproxyenvoy
    #image: "curiefense/curieproxy-envoy:${DOCKER_TAG}"
    image: "curiefense/curieproxy-envoy:${DOCKER_TAG_ENVOY_PROXY}"   # <-- CUSTOM IMAGE VERSION
    restart: always
    volumes:
      - curieproxy_config:/cf-config
      - ./filebeat/ilm.json:/usr/share/filebeat/ilm.json
      - ./filebeat/template.json:/usr/share/filebeat/template.json
    environment:
      - ENVOY_UID
      - TARGET_ADDRESS_A=${TARGET_ADDRESS_A:-pxcs-service.sandbox.diit.health}
      - TARGET_PORT_A=${TARGET_PORT_A:-443}
      - TARGET_ADDRESS_B=${TARGET_ADDRESS_B:-juiceshop}
      - TARGET_PORT_B=${TARGET_PORT_B:-3000}
      - XFF_TRUSTED_HOPS
      - ENVOY_LOG_LEVEL
      - FILEBEAT
      - FILEBEAT_LOG_LEVEL
      - ELASTICSEARCH_URL=${ELASTICSEARCH_URL:-http://elasticsearch:9200}
      - KIBANA_URL=${KIBANA_URL:-http://kibana:5601}
    networks:
      curiemesh:
        aliases:
          - curieproxy
    ports:
      - "80:80"
      - "443:443"
      - "8001:8001"
    secrets:
      - curieproxysslcrt
      - curieproxysslkey
. . .
Caveats
Replacing elasticsearch with Grafana-loki does not seem to be possible at the moment I am writing this post.
The only item I could find which refers to a possible implementation relates to this post: https://github.com/curiefense/curiefense/issues/4
-
Kubernetes security: Detect and react to intrusions with Falco
Table of Contents
Intro
Falco is an open-source application that you can use to detect (and, optionally, react) intrusions.
It comes with a set of pre-installed rules to which exceptions can be easily added.
Custom rules can of course be installed as well.
Events can be fetched both interacting with a kernel module, eBPF probes are also supported.
This guide covers first use-case above and relates to deployment via helm chart within a kubernetes cluster.
Installation
Pre-requisites
This guide assumes you have a pre-installed kubernetes cluster (on-premise) with all necessary configurations to use kubectl.
Debian / Ubuntu based OS
Install packages required to fetch syscall from host OS kernel:
curl -s https://falco.org/repo/falcosecurity-3672BA8F.asc | apt-key add -
echo "deb https://download.falco.org/packages/deb stable main" | tee -a /etc/apt/sources.list.d/falcosecurity.list
apt-get update -y
apt-get -y install linux-headers-$(uname -r)
CentOS/RHEL/Fedora/Amazon Linux based OS
rpm --import https://falco.org/repo/falcosecurity-3672BA8F.asc
curl -s -o /etc/yum.repos.d/falcosecurity.repo https://falco.org/repo/falcosecurity-rpm.repo
yum -y install kernel-devel-$(uname -r)
Installing via helm chart
helm repo add falcosecurity https://falcosecurity.github.io/charts
helm repo update
Now, create the namespace:
kubectl create namespace falco
Create a new PersistentVolume. Make sure to replace the following attributes according to your needs/environment:
- spec.capacity.storage
- spec.local.path (pathname of local directory on your host node)
- spec.nodeAffinity.required.nodeSelectorTerms.matchExpressions.key.value (must match your k8s node’s name)
apiVersion: v1
kind: PersistentVolume
metadata:
  annotations:
  finalizers:
  - kubernetes.io/pv-protection
  name: redis-data
  namespace: falco
spec:
  accessModes:
  - ReadWriteOnce
  capacity:
    storage: 5Gi
  local:
    path: YOUR_LOCAL_PATH_HERE
  nodeAffinity:
    required:
      nodeSelectorTerms:
      - matchExpressions:
        - key: kubernetes.io/hostname
          operator: In
          values:
          - YOUR_NODE_NAME_HERE
  persistentVolumeReclaimPolicy: Retain
  volumeMode: Filesystem
Install the helm chart:
helm install falco \
  --set falco.grpc.enabled=true \
  --set falco.grpc_output.enabled=true \
  --set falcosidekick.enabled=true \
  --set falcosidekick.webui.enabled=true \
  falcosecurity/falco \
  --namespace falco
Make sure all pods are up and running:
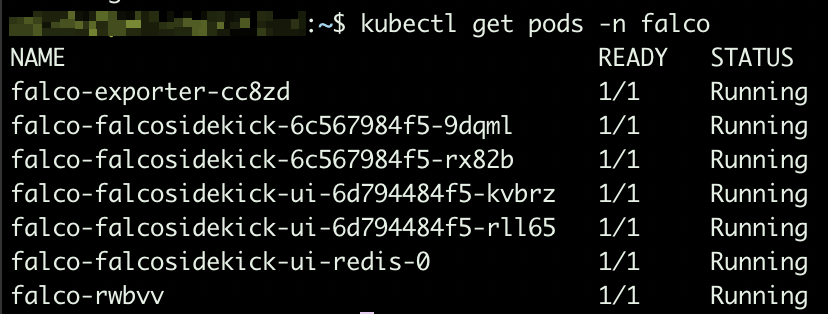
Falco pods Based on the arguments we provided while installing the helm chart, sidekick UI is enabled. To make it accessible, you will have to expose port 2802:
kubectl expose service falco-falcosidekick-ui --port=2802 --target-port=2802 --external-ip=YOUR_NODE_IP_ADDRESS --name=falco-falcosidekick-ui-external -n falco
From this moment, you should be able to access sidekick UI at http://YOUR_NODE_IP_ADDRESS:2802
Default credentials: admin/admin
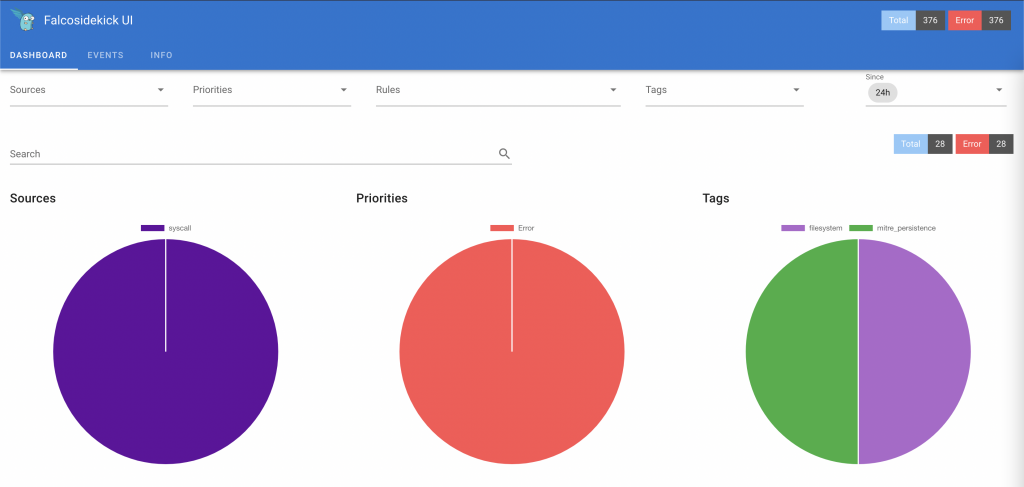
Falco sidekick UI Adding rules exceptions
You might need to add exceptions to pre-installed rules since they might be too restrictive based on how you use this system.
To do so, create a yaml file (e.g. rules_exceptions.yaml) and add your exceptions.
Sample:
customRules:
  custom_rules_from_default: |-
    - rule: Read sensitive file untrusted
      append: true
      exceptions:
      - name: microsoft_omsagent_plugin
        fields: [container.id, fd.name, proc.cmdline, proc.name, proc.pname, user.name]
        comps: [=, =, =, =, =, =]
        values:
        - [host, /etc/shadow, omsbaseline -d /opt/microsoft/omsagent/plugin/, omsbaseline, omsbaseline, root]
      - name: wdavdaemon
        fields: [proc.name]
        comps: [=]
        values:
        - [wdavdaemon]
2nd rule above (name: wdavdaemon) will not fire any alert in case default settings for rule “wdavdaemon” are satisfied but the syscall attribute proc.name = “wdavdaemon”.
1st rule above is providing an exception based on value from multiple attributes (container.id, fd.name, etc.)
To install the new rule file, upgrade the helm chart:
helm upgrade --install falco falcosecurity/falco --namespace falco --reuse-values -f rules_exceptions.yaml
Whenever an event breaks a security rule, it gets logged to stdout.
Exporting events to Prometheus
stdout from falco core can be made available as application metric so that Prometheus can easily scrape such endpoint and have access to all events.
To do so, we need to deploy an extra component: Falco exporter (see https://github.com/falcosecurity/falco-exporter)
This component can be easily installed via helm chart:
helm install falco-exporter falcosecurity/falco-exporter --namespace falco
Falco-exporter is available, by default, on port 9376. In case your Prometheus instance is running on a different host, you will have to expose the port:
helm install falco-exporter falcosecurity/falco-exporter --namespace falco
 kubectl expose service falco-exporter --port=9376 --target-port=9376 --external-ip=YOUR_NODE_IP_HERE --name=falco-exporter-external -n falco
From this moment, you can add http://YOUR_NODE_IP:9376 as additional scrape target to your Prometheus configuration.
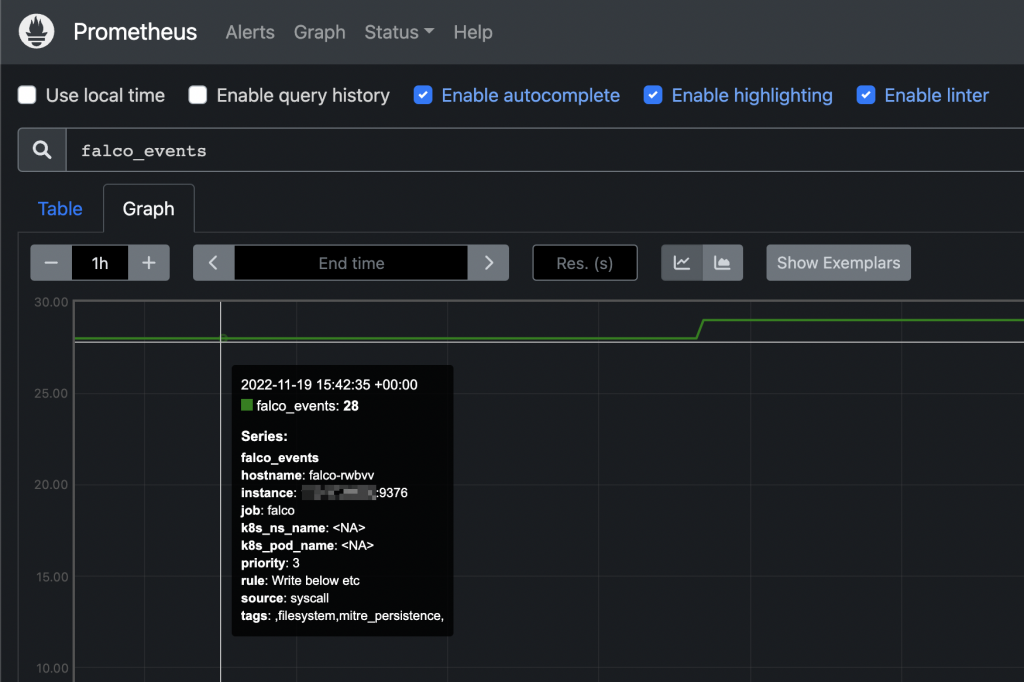
Falco events on Prometheus UI From this moment you can add custom alerts on Prometheus or, even better, create your owns from Grafana’s UI.
Adding custom alerts to Prometheus How to send email notifications from Grafana alerts