
Kubernetes security: Detect and react to intrusions with Falco
Table of Contents
Intro
Falco is an open-source application that you can use to detect (and, optionally, react) intrusions.
It comes with a set of pre-installed rules to which exceptions can be easily added.
Custom rules can of course be installed as well.
Events can be fetched both interacting with a kernel module, eBPF probes are also supported.
This guide covers first use-case above and relates to deployment via helm chart within a kubernetes cluster.
Installation
Pre-requisites
This guide assumes you have a pre-installed kubernetes cluster (on-premise) with all necessary configurations to use kubectl.
Debian / Ubuntu based OS
Install packages required to fetch syscall from host OS kernel:
curl -s https://falco.org/repo/falcosecurity-3672BA8F.asc | apt-key add -
echo "deb https://download.falco.org/packages/deb stable main" | tee -a /etc/apt/sources.list.d/falcosecurity.list
apt-get update -y
apt-get -y install linux-headers-$(uname -r)
CentOS/RHEL/Fedora/Amazon Linux based OS
rpm --import https://falco.org/repo/falcosecurity-3672BA8F.asc
curl -s -o /etc/yum.repos.d/falcosecurity.repo https://falco.org/repo/falcosecurity-rpm.repo
yum -y install kernel-devel-$(uname -r)
Installing via helm chart
helm repo add falcosecurity https://falcosecurity.github.io/charts
helm repo update
Now, create the namespace:
kubectl create namespace falco
Create a new PersistentVolume. Make sure to replace the following attributes according to your needs/environment:
- spec.capacity.storage
- spec.local.path (pathname of local directory on your host node)
- spec.nodeAffinity.required.nodeSelectorTerms.matchExpressions.key.value (must match your k8s node’s name)
apiVersion: v1
kind: PersistentVolume
metadata:
  annotations:
  finalizers:
  - kubernetes.io/pv-protection
  name: redis-data
  namespace: falco
spec:
  accessModes:
  - ReadWriteOnce
  capacity:
    storage: 5Gi
  local:
    path: YOUR_LOCAL_PATH_HERE
  nodeAffinity:
    required:
      nodeSelectorTerms:
      - matchExpressions:
        - key: kubernetes.io/hostname
          operator: In
          values:
          - YOUR_NODE_NAME_HERE
  persistentVolumeReclaimPolicy: Retain
  volumeMode: Filesystem
Install the helm chart:
helm install falco \
  --set falco.grpc.enabled=true \
  --set falco.grpc_output.enabled=true \
  --set falcosidekick.enabled=true \
  --set falcosidekick.webui.enabled=true \
  falcosecurity/falco \
  --namespace falco
Make sure all pods are up and running:
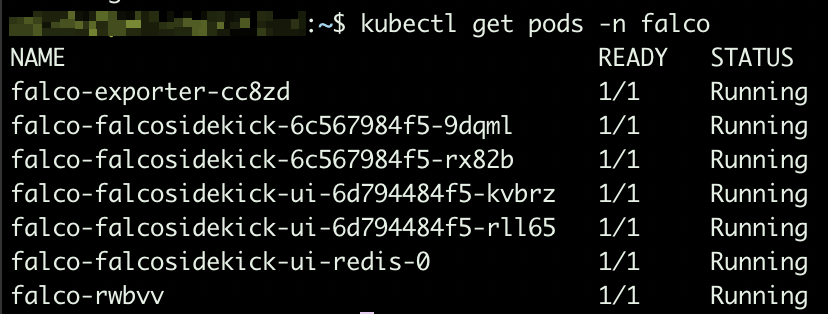
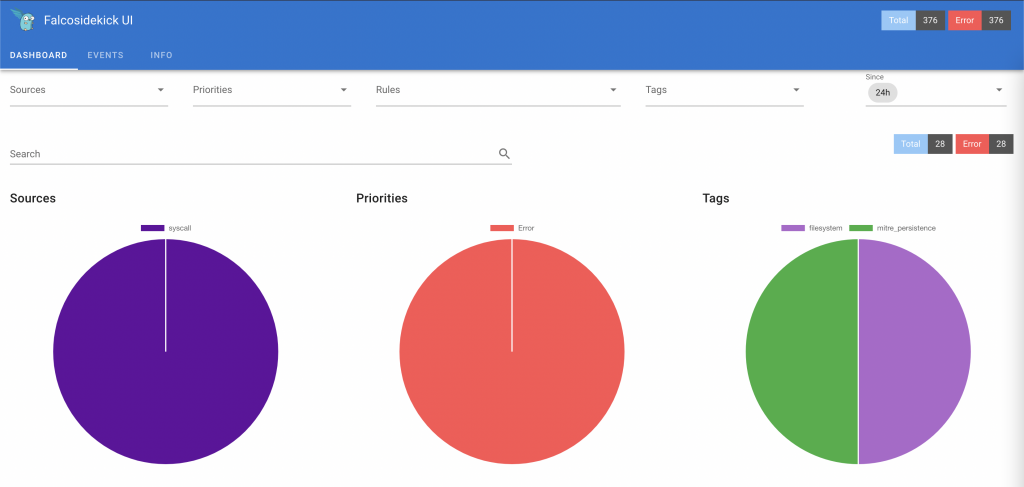
Based on the arguments we provided while installing the helm chart, sidekick UI is enabled. To make it accessible, you will have to expose port 2802:
kubectl expose service falco-falcosidekick-ui --port=2802 --target-port=2802 --external-ip=YOUR_NODE_IP_ADDRESS --name=falco-falcosidekick-ui-external -n falco
From this moment, you should be able to access sidekick UI at http://YOUR_NODE_IP_ADDRESS:2802
Default credentials: admin/admin
Adding rules exceptions
You might need to add exceptions to pre-installed rules since they might be too restrictive based on how you use this system.
To do so, create a yaml file (e.g. rules_exceptions.yaml) and add your exceptions.
Sample:
customRules:
  custom_rules_from_default: |-
    - rule: Read sensitive file untrusted
      append: true
      exceptions:
      - name: microsoft_omsagent_plugin
        fields: [container.id, fd.name, proc.cmdline, proc.name, proc.pname, user.name]
        comps: [=, =, =, =, =, =]
        values:
        - [host, /etc/shadow, omsbaseline -d /opt/microsoft/omsagent/plugin/, omsbaseline, omsbaseline, root]
      - name: wdavdaemon
        fields: [proc.name]
        comps: [=]
        values:
        - [wdavdaemon]
2nd rule above (name: wdavdaemon) will not fire any alert in case default settings for rule “wdavdaemon” are satisfied but the syscall attribute proc.name = “wdavdaemon”.
1st rule above is providing an exception based on value from multiple attributes (container.id, fd.name, etc.)
To install the new rule file, upgrade the helm chart:
helm upgrade --install falco falcosecurity/falco --namespace falco --reuse-values -f rules_exceptions.yaml
Whenever an event breaks a security rule, it gets logged to stdout.
Exporting events to Prometheus
stdout from falco core can be made available as application metric so that Prometheus can easily scrape such endpoint and have access to all events.
To do so, we need to deploy an extra component: Falco exporter (see https://github.com/falcosecurity/falco-exporter)
This component can be easily installed via helm chart:
helm install falco-exporter falcosecurity/falco-exporter --namespace falco
Falco-exporter is available, by default, on port 9376. In case your Prometheus instance is running on a different host, you will have to expose the port:
helm install falco-exporter falcosecurity/falco-exporter --namespace falco
 kubectl expose service falco-exporter --port=9376 --target-port=9376 --external-ip=YOUR_NODE_IP_HERE --name=falco-exporter-external -n falco
From this moment, you can add http://YOUR_NODE_IP:9376 as additional scrape target to your Prometheus configuration.
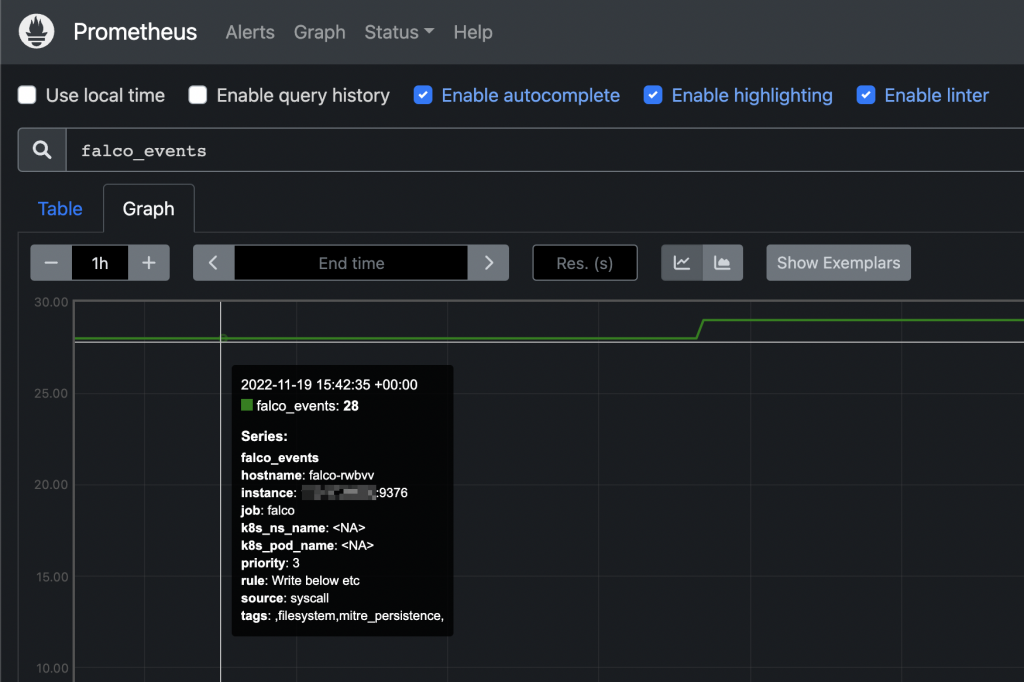
From this moment you can add custom alerts on Prometheus or, even better, create your owns from Grafana’s UI.