Prometheus
-
Prometheus operator – how to add custom alerts
Learn how to add your custom rules to prometheus-operator running on kubernetes
Prometheus-operator comes with a set of pre-installed alerting rules, but typically you want to add extra ones, looking after your own application running on the kubernetes cluster.
This page shows you how.
- Create a new ConfigMap that includes all your new custom groups and related rules. Sample yaml manifest:
apiVersion: monitoring.coreos.com/v1 kind: PrometheusRule metadata: labels: prometheus: prometheus-kube-prometheus-prometheus role: alert-rules release: prometheus name: prometheus-test-rules namespace: monitoring spec: groups: - name: ./test.rules rules: - alert: No connections to external systems expr: (application_test_ext_system_total > 0) and (application_test_ext_system_connections_count_total == 0) for: 3m labels: severity: warning - name: ./test-ddos.rules rules: - alert: Detect anomalies on network traffic expr: (( rate(node_network_receive_packets_total[5m]) / rate(node_network_receive_packets_total[5m] offset 5m)) > 10) and ( rate(node_network_receive_packets_total[5m]) > 1000) for: 3m labels: severity: warning- Restart your prometheus master pod so that the new ConfigMap created above is loaded:
$ kubectl delete -n monitoring $(k get pods -n monitoring -o=name -l operator.prometheus.io/name=prometheus-kube-prometheus-prometheus)
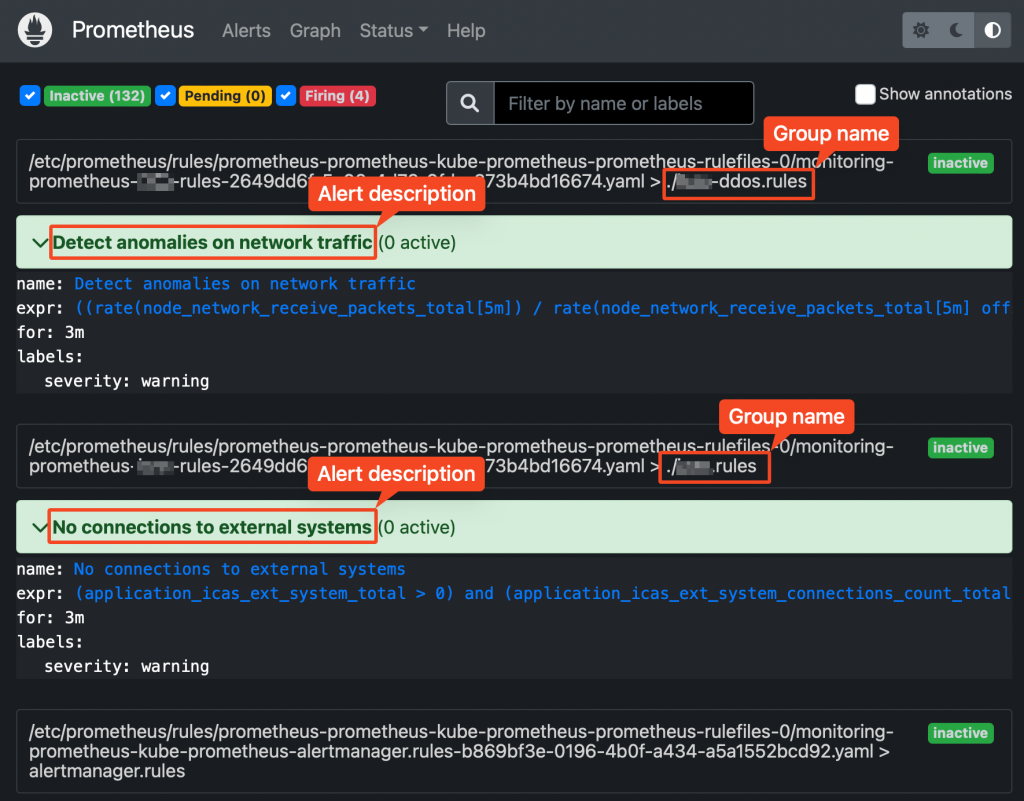
Prometheus web UI Checking rules validity
Alerting rules are going through a syntax check at prometheus core startup.
This can also be done upfront, using the “promtool” utility, part of prometheus core container.
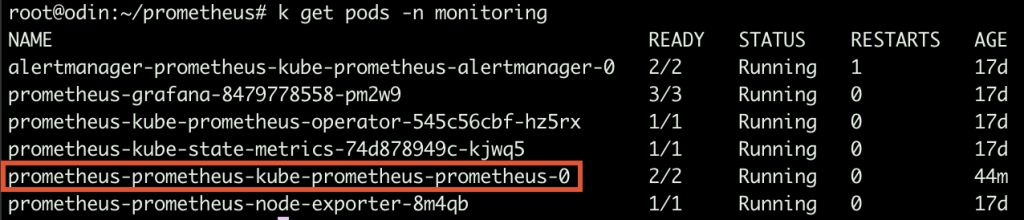
Prometheus running Pods Syntax:
$ promtool check config your_custom_rules_file.yaml
Sample rules yaml file:
groups:
- name: ./test.rules
  rules:
  - alert: No connections to external systems
    expr: (application_test_ext_system_total > 0) and (application_test_ext_system_connections_count_total == 0)
    for: 3m
    labels:
      severity: warning
- name: ./test-ddos.rules
  rules:
  - alert: Detect anomalies on network traffic
    expr: (( rate(node_network_receive_packets_total[5m]) / rate(node_network_receive_packets_total[5m] offset 5m)) > 10) and ( rate(node_network_receive_packets_total[5m]) > 1000)
    for: 3m
    labels:
      severity: warning
Prometheus does NOT check whether the metrics/labels you provide on the custom rules ConfigMap are valid and existing.
To retrieve the list of available metrics, you can create a new panel on Grafana and take advantage of auto-completion or just use the Prometheus web UI.