Monitoring application health with blackbox-exporter
Prometheus standard deployment and configuration has already been discussed on other posts, but what if you want to expose metrics about your custom application stack health? This page explains how to achieve this, by taking advantage of blackbox-exporter, so that your application components running on a kubernetes cluster will be easily monitored.
Intro
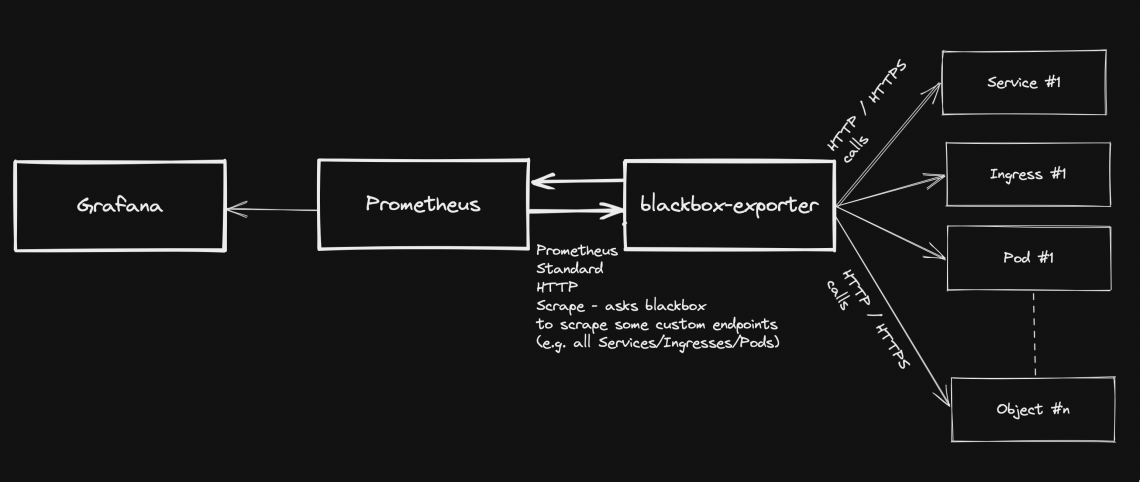
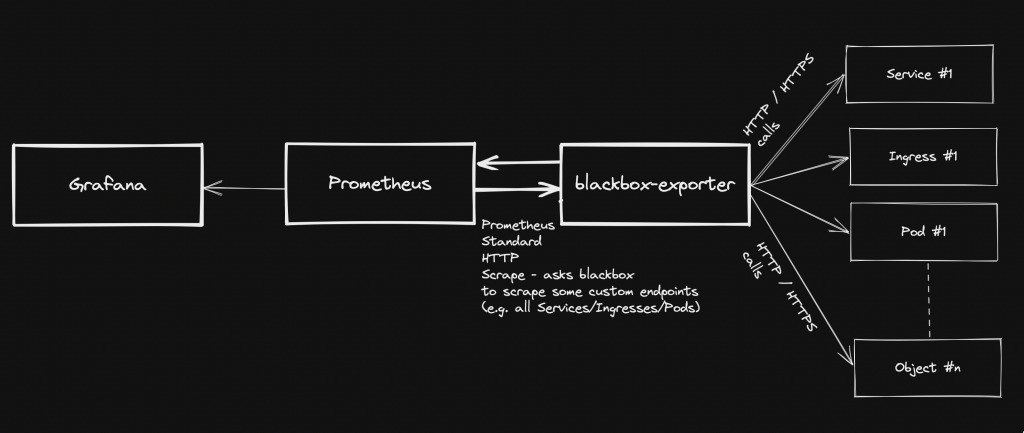
Generally speaking, blackbox stands in between your Prometheus instance and your custom application components: Prometheus fetches metrics asking blackbox to target custom endpoints. Response will be given back using the format expected by Prometheus. Endspoints are typically your cluster’s Pods, Services and Ingresses.
Pre-requirements
- A kubernetes cluster with kubectl configured to interact with it
- Prometheus-operator stack – see https://github.com/prometheus-operator/prometheus-operator
- Grafana (part of Prometheus-operator)
blackbox-exporter installation (via helm chart)
- Add the helm repo
helm repo add prometheus-community https://prometheus-community.github.io/helm-charts
help repo update
- Create a file: values.yaml
config:
  modules:
    http_2xx:
      prober: http
      timeout: 5s
      http:
        valid_http_versions: ["HTTP/1.1", "HTTP/2.0"]
        follow_redirects: true
        preferred_ip_protocol: "ip4"
- Install the helm chart (in this case, we are using “monitoring” namespace):
helm install prometheus-blackbox prometheus-community/prometheus-blackbox-exporter -n monitoring -f values.yaml
Adding custom scrape targets to blackbox
As regards how to add extra scrape targets, see https://matteorenzi.com/2022/10/08/prometheus-operator-how-to-add-custom-scrape-targets/
Below some sample targets that you might want to add:
Probing external targets (sample: www.google.com)
- job_name: 'blackbox-external-targets'
  metrics_path: /probe
  params:
    module: [http_2xx]
  static_configs:
    - targets:
      - https://www.google.com
  relabel_configs:
    - source_labels: [__address__]
      target_label: __param_target
    - source_labels: [__param_target]
      target_label: instance
    - target_label: __address__
      replacement: prometheus-blackbox-prometheus-blackbox-exporter.monitoring.svc.cluster.local:9115
Probing your cluster Services
- job_name: "blackbox-kubernetes-services"
  metrics_path: /probe
  params:
    module: [http_2xx]
  kubernetes_sd_configs:
  - role: service
  relabel_configs:
    - source_labels: [__address__]
      target_label: __param_target
    - target_label: __address__
      replacement:  prometheus-blackbox-prometheus-blackbox-exporter.monitoring.svc.cluster.local:9115
    - source_labels: [__param_target]
      target_label: instance
    - action: labelmap
      regex: __meta_kubernetes_service_label_(.+)
    - source_labels: [__meta_kubernetes_namespace]
      target_label: kubernetes_namespace
    - source_labels: [__meta_kubernetes_service_name]
      target_label: kubernetes_service_name
Probing cluster Ingresses
- job_name: "blackbox-kubernetes-ingresses"
  metrics_path: /probe
  params:
    module: [http_2xx]
  kubernetes_sd_configs:
  - role: ingress
  relabel_configs:
    - source_labels:
        [
          __meta_kubernetes_ingress_scheme,
          __address__,
          __meta_kubernetes_ingress_path,
        ]
      regex: (.+);(.+);(.+)
      replacement: ://
      target_label: __param_target
    - target_label: __address__
      replacement: prometheus-blackbox-prometheus-blackbox-exporter.monitoring.svc.cluster.local:9115
    - source_labels: [__param_target]
      target_label: instance
    - action: labelmap
      regex: __meta_kubernetes_ingress_label_(.+)
    - source_labels: [__meta_kubernetes_namespace]
      target_label: kubernetes_namespace
    - source_labels: [__meta_kubernetes_ingress_name]
      target_label: ingress_name
Probing cluster Pods
- job_name: "blackbox-kubernetes-pods"
  metrics_path: /probe
  params:
    module: [http_2xx]
  kubernetes_sd_configs:
  - role: pod
  relabel_configs:
    - source_labels: [__address__]
      target_label: __param_target
    - target_label: __address__
      replacement: prometheus-blackbox-prometheus-blackbox-exporter.monitoring.svc.cluster.local:9115
    - source_labels: [__param_target]
      replacement: /health
      target_label: instance
    - action: labelmap
      regex: __meta_kubernetes_pod_label_(.+)
    - source_labels: [__meta_kubernetes_namespace]
      target_label: kubernetes_namespace
    - source_labels: [__meta_kubernetes_pod_name]
      target_label: kubernetes_pod_name
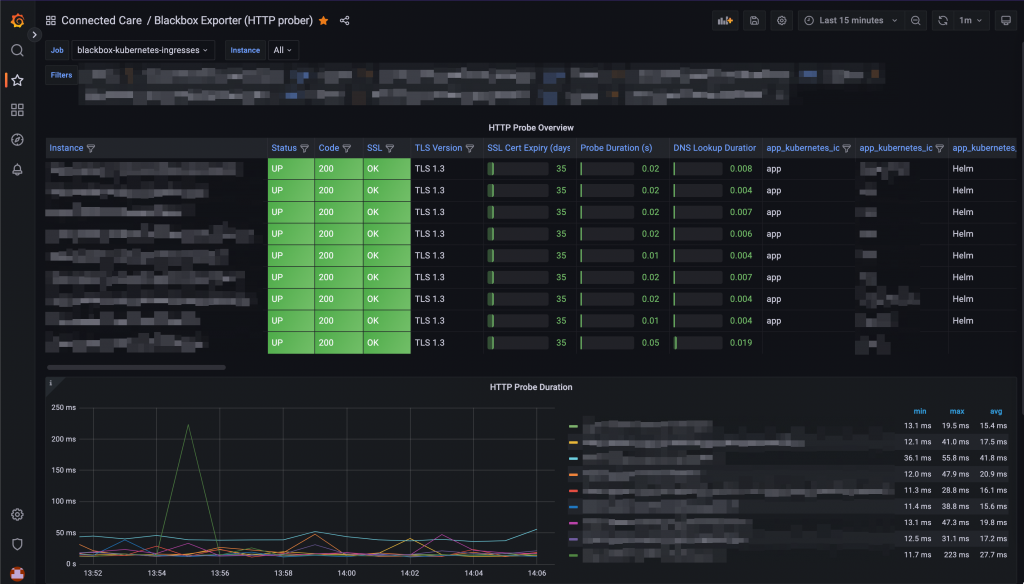
Checking new targets / probes
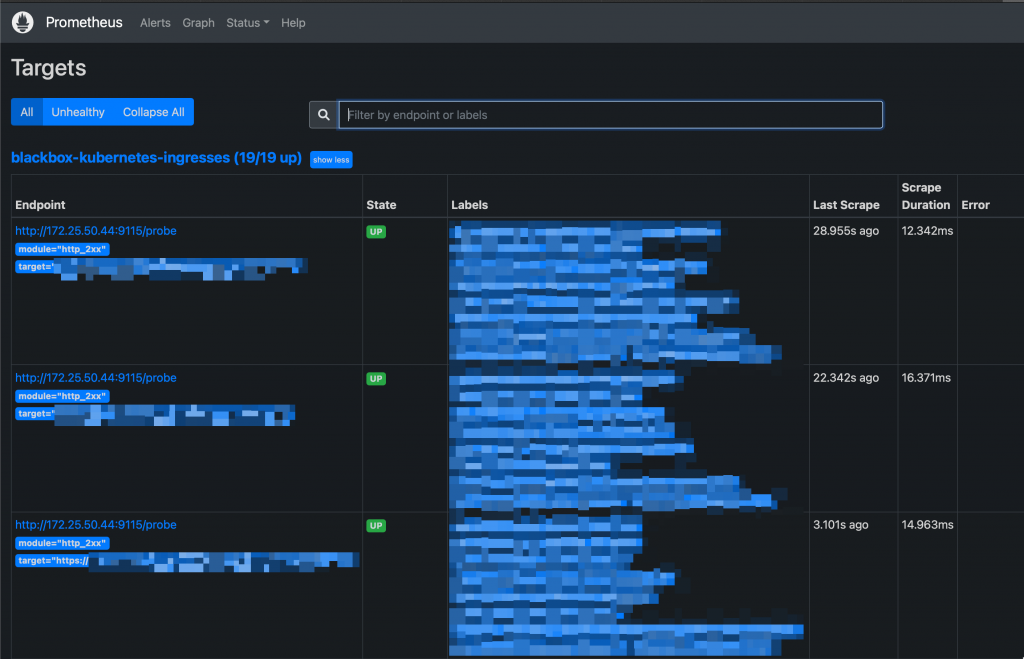
Once the new scraping targets have been applied, they must be visible on Prometheus: Status -> Targets
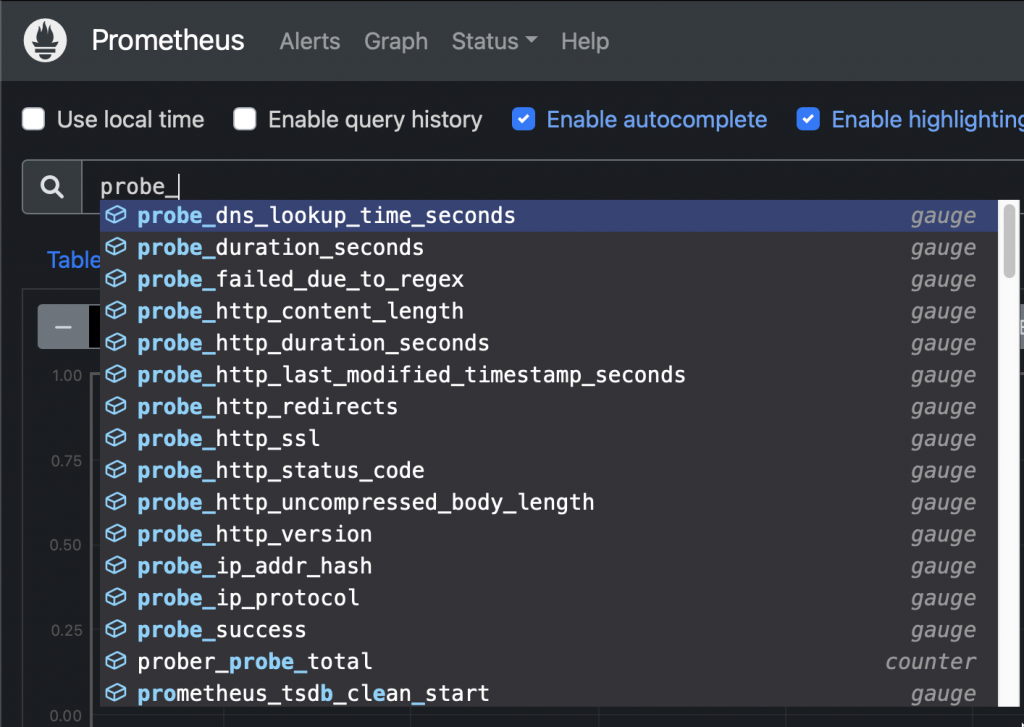
Probes can be queried like this:
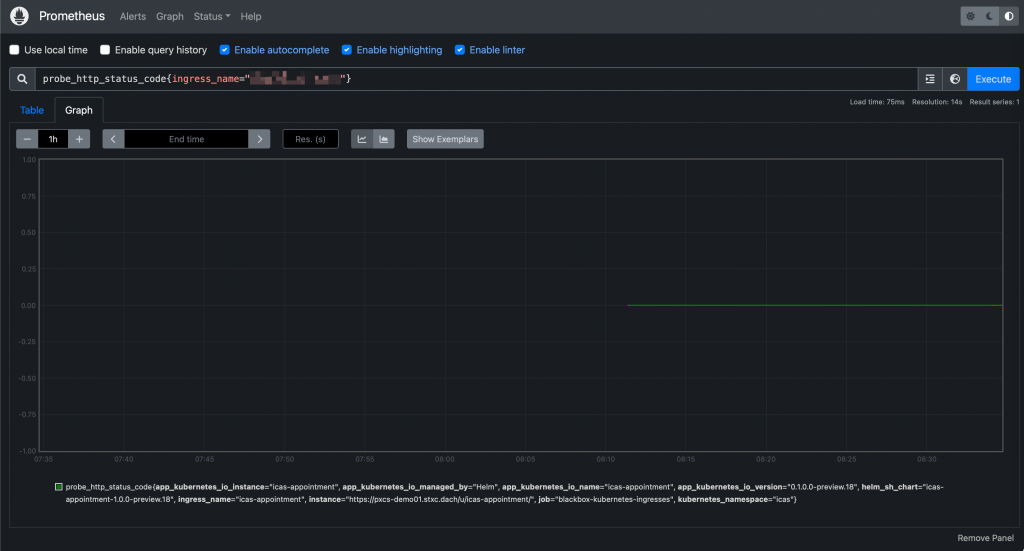
Sample query: Check HTTP status code from an ingress:
probe_http_status_code{ingress_name="xxxxx"}
And they will be accessible from Grafana as well: