-
Monitoring application health with blackbox-exporter
Prometheus standard deployment and configuration has already been discussed on other posts, but what if you want to expose metrics about your custom application stack health? This page explains how to achieve this, by taking advantage of blackbox-exporter, so that your application components running on a kubernetes cluster will be easily monitored.
Intro
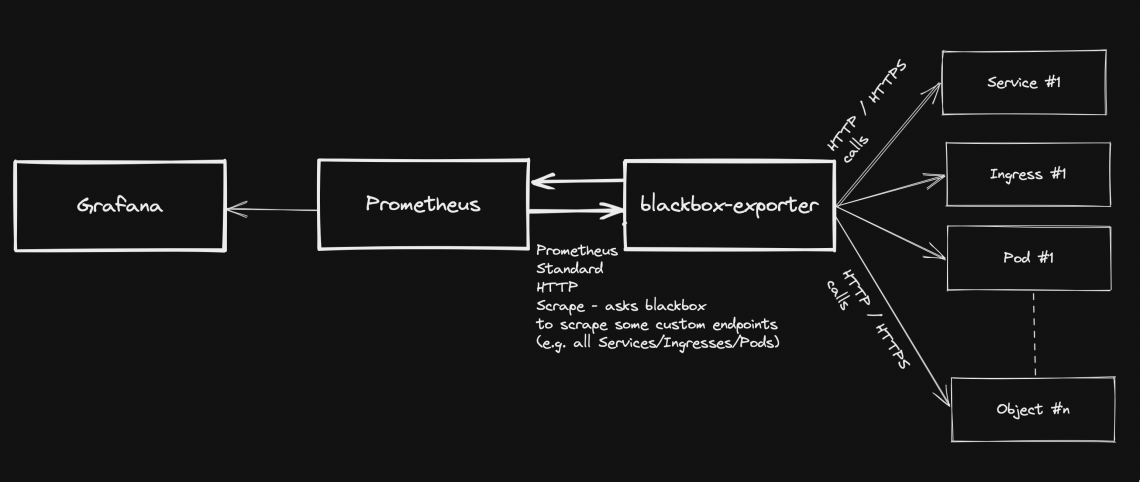
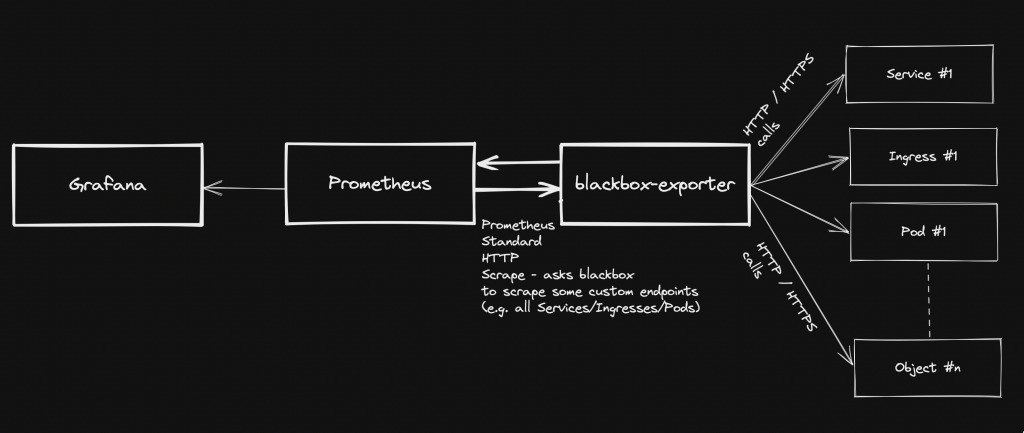
Generally speaking, blackbox stands in between your Prometheus instance and your custom application components: Prometheus fetches metrics asking blackbox to target custom endpoints. Response will be given back using the format expected by Prometheus. Endspoints are typically your cluster’s Pods, Services and Ingresses.
Overview Pre-requirements
- A kubernetes cluster with kubectl configured to interact with it
- Prometheus-operator stack – see https://github.com/prometheus-operator/prometheus-operator
- Grafana (part of Prometheus-operator)
blackbox-exporter installation (via helm chart)
- Add the helm repo
helm repo add prometheus-community https://prometheus-community.github.io/helm-charts
help repo update
- Create a file: values.yaml
config: modules: http_2xx: prober: http timeout: 5s http: valid_http_versions: ["HTTP/1.1", "HTTP/2.0"] follow_redirects: true preferred_ip_protocol: "ip4"- Install the helm chart (in this case, we are using “monitoring” namespace):
helm install prometheus-blackbox prometheus-community/prometheus-blackbox-exporter -n monitoring -f values.yaml
Adding custom scrape targets to blackbox
As regards how to add extra scrape targets, see https://matteorenzi.com/2022/10/08/prometheus-operator-how-to-add-custom-scrape-targets/
Below some sample targets that you might want to add:
Probing external targets (sample: www.google.com)
- job_name: 'blackbox-external-targets'
  metrics_path: /probe
  params:
    module: [http_2xx]
  static_configs:
    - targets:
      - https://www.google.com
  relabel_configs:
    - source_labels: [__address__]
      target_label: __param_target
    - source_labels: [__param_target]
      target_label: instance
    - target_label: __address__
      replacement: prometheus-blackbox-prometheus-blackbox-exporter.monitoring.svc.cluster.local:9115
Probing your cluster Services
- job_name: "blackbox-kubernetes-services"
  metrics_path: /probe
  params:
    module: [http_2xx]
  kubernetes_sd_configs:
  - role: service
  relabel_configs:
    - source_labels: [__address__]
      target_label: __param_target
    - target_label: __address__
      replacement:  prometheus-blackbox-prometheus-blackbox-exporter.monitoring.svc.cluster.local:9115
    - source_labels: [__param_target]
      target_label: instance
    - action: labelmap
      regex: __meta_kubernetes_service_label_(.+)
    - source_labels: [__meta_kubernetes_namespace]
      target_label: kubernetes_namespace
    - source_labels: [__meta_kubernetes_service_name]
      target_label: kubernetes_service_name
Probing cluster Ingresses
- job_name: "blackbox-kubernetes-ingresses"
  metrics_path: /probe
  params:
    module: [http_2xx]
  kubernetes_sd_configs:
  - role: ingress
  relabel_configs:
    - source_labels:
        [
          __meta_kubernetes_ingress_scheme,
          __address__,
          __meta_kubernetes_ingress_path,
        ]
      regex: (.+);(.+);(.+)
      replacement: ://
      target_label: __param_target
    - target_label: __address__
      replacement: prometheus-blackbox-prometheus-blackbox-exporter.monitoring.svc.cluster.local:9115
    - source_labels: [__param_target]
      target_label: instance
    - action: labelmap
      regex: __meta_kubernetes_ingress_label_(.+)
    - source_labels: [__meta_kubernetes_namespace]
      target_label: kubernetes_namespace
    - source_labels: [__meta_kubernetes_ingress_name]
      target_label: ingress_name
Probing cluster Pods
- job_name: "blackbox-kubernetes-pods"
  metrics_path: /probe
  params:
    module: [http_2xx]
  kubernetes_sd_configs:
  - role: pod
  relabel_configs:
    - source_labels: [__address__]
      target_label: __param_target
    - target_label: __address__
      replacement: prometheus-blackbox-prometheus-blackbox-exporter.monitoring.svc.cluster.local:9115
    - source_labels: [__param_target]
      replacement: /health
      target_label: instance
    - action: labelmap
      regex: __meta_kubernetes_pod_label_(.+)
    - source_labels: [__meta_kubernetes_namespace]
      target_label: kubernetes_namespace
    - source_labels: [__meta_kubernetes_pod_name]
      target_label: kubernetes_pod_name
Checking new targets / probes
Once the new scraping targets have been applied, they must be visible on Prometheus: Status -> Targets
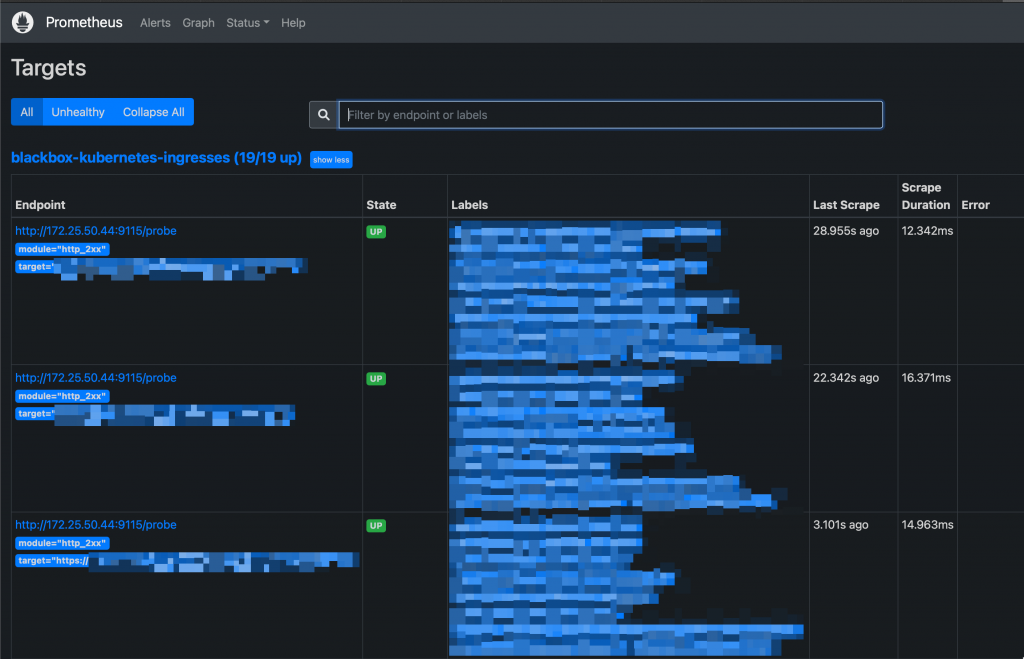
New Targets on Prometheus UI Probes can be queried like this:
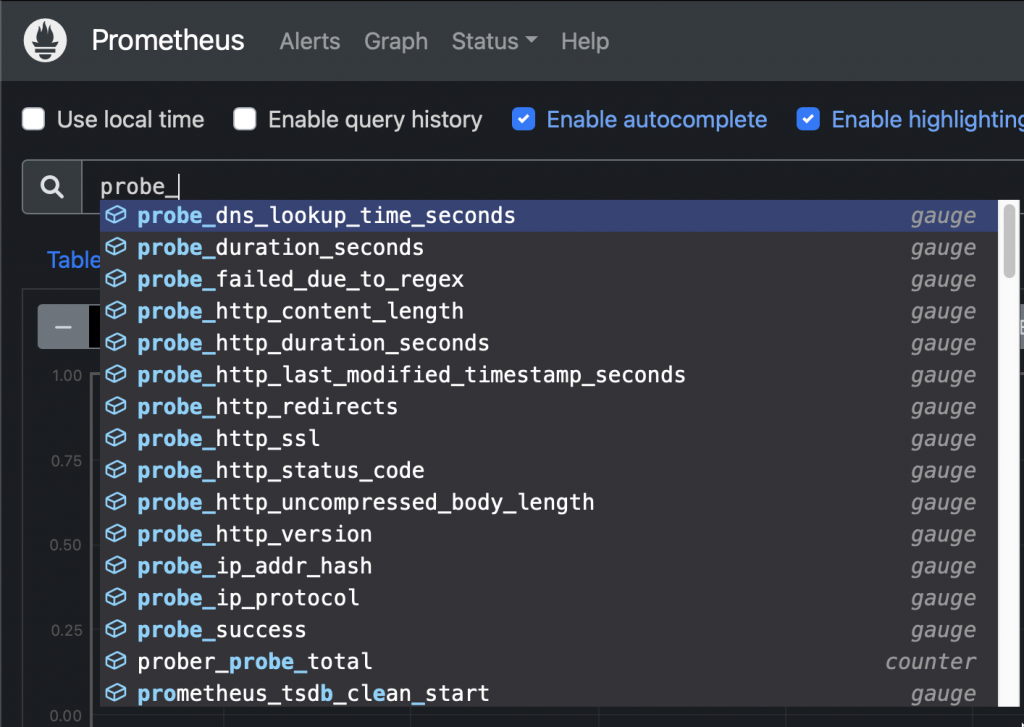
New probes Sample query: Check HTTP status code from an ingress:
probe_http_status_code{ingress_name="xxxxx"}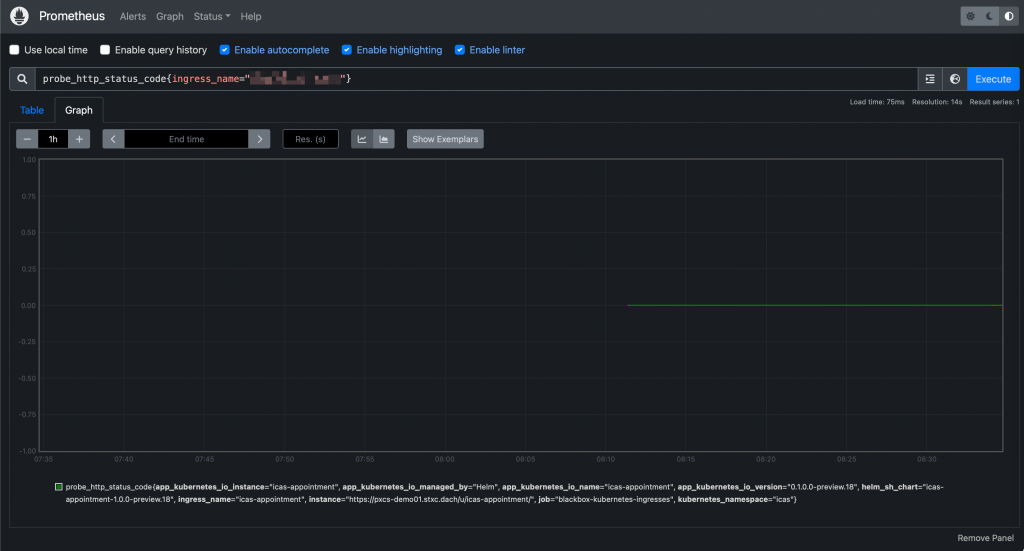
Prometheus UI: Querying a probe And they will be accessible from Grafana as well:
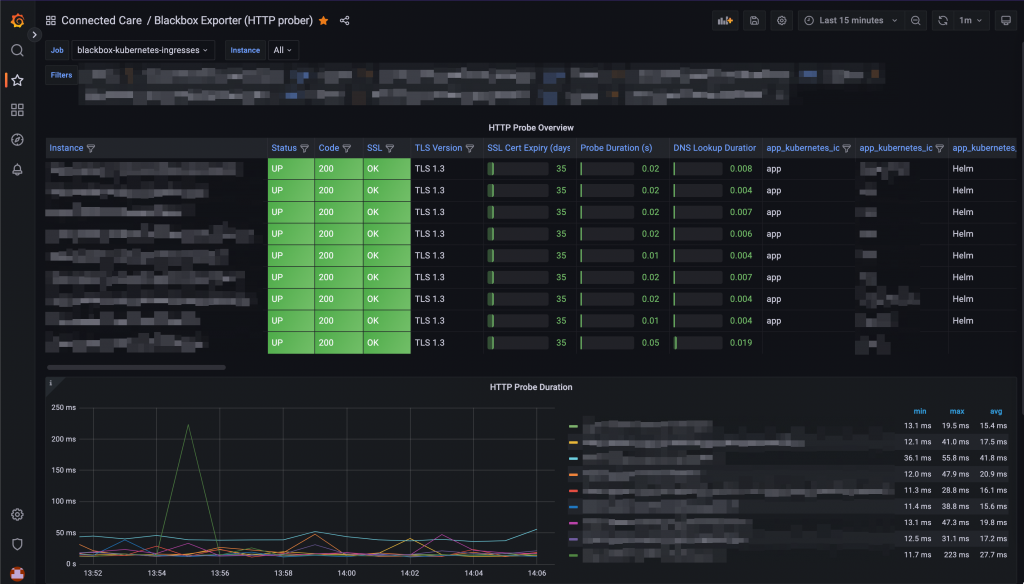
Probes visualisation on a Grafana dashboard -
Prometheus-operator: How to modify or delete pre-installed alerts
This guide relates to Prometheus-operator.
Prometheus-operator operator comes with a set of pre-installed alerts. This page shows you how to edit/remove them.
- Prometheus operator stores rules into PrometheusRule objects. In case you found a rule by looking into the Prometheus web UI, first thing you have to do is determine the group name:
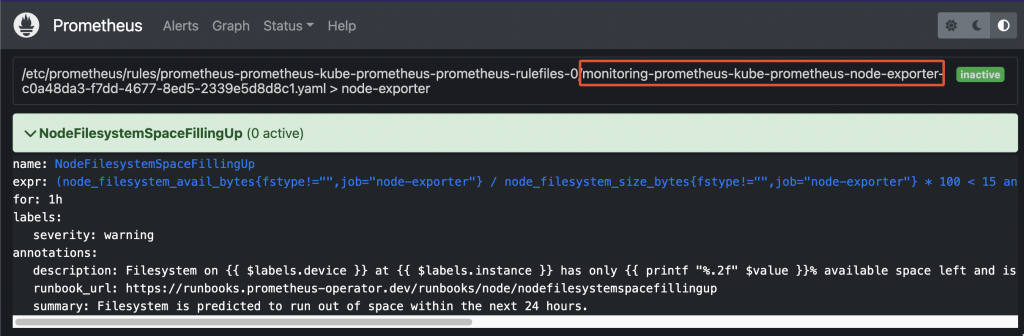
Prometheus pre-existing rule - Now, retrieve the list of all PrometheusRule objects available within the cluster:
root@odin:~/prometheus# kubectl get prometheusrule -n monitoring
NAME                                                              AGE
prometheus-icas-rules                                             7d2h
prometheus-kube-prometheus-alertmanager.rules                     22d
prometheus-kube-prometheus-config-reloaders                       22d
prometheus-kube-prometheus-etcd                                   22d
prometheus-kube-prometheus-general.rules                          22d
prometheus-kube-prometheus-k8s.rules                              22d
prometheus-kube-prometheus-kube-apiserver-availability.rules      22d
prometheus-kube-prometheus-kube-apiserver-burnrate.rules          22d
prometheus-kube-prometheus-kube-apiserver-histogram.rules         22d
prometheus-kube-prometheus-kube-apiserver-slos                    22d
prometheus-kube-prometheus-kube-prometheus-general.rules          22d
prometheus-kube-prometheus-kube-prometheus-node-recording.rules   22d
prometheus-kube-prometheus-kube-scheduler.rules                   22d
prometheus-kube-prometheus-kube-state-metrics                     22d
prometheus-kube-prometheus-kubelet.rules                          22d
prometheus-kube-prometheus-kubernetes-apps                        22d
prometheus-kube-prometheus-kubernetes-resources                   22d
prometheus-kube-prometheus-kubernetes-storage                     22d
prometheus-kube-prometheus-kubernetes-system                      22d
prometheus-kube-prometheus-kubernetes-system-apiserver            22d
prometheus-kube-prometheus-kubernetes-system-controller-manager   22d
prometheus-kube-prometheus-kubernetes-system-kube-proxy           22d
prometheus-kube-prometheus-kubernetes-system-kubelet              22d
prometheus-kube-prometheus-kubernetes-system-scheduler            22d
prometheus-kube-prometheus-node-exporter                          22d    <------
prometheus-kube-prometheus-node-exporter.rules                    22d
prometheus-kube-prometheus-node-network                           22d
prometheus-kube-prometheus-node.rules                             22d
prometheus-kube-prometheus-prometheus                             22d
prometheus-kube-prometheus-prometheus-operator                    22d
- Now you can edit the object and change/delete the rule:
root@odin:~/prometheus# kubectl edit prometheusrule/prometheus-kube-prometheus-node-exporter -n monitoring # Please edit the object below. Lines beginning with a '#' will be ignored, # and an empty file will abort the edit. If an error occurs while saving this file will be # reopened with the relevant failures. # apiVersion: monitoring.coreos.com/v1 kind: PrometheusRule metadata: annotations: meta.helm.sh/release-name: prometheus meta.helm.sh/release-namespace: monitoring creationTimestamp: "2022-09-15T07:20:01Z" generation: 1 labels: app: kube-prometheus-stack app.kubernetes.io/instance: prometheus app.kubernetes.io/managed-by: Helm app.kubernetes.io/part-of: kube-prometheus-stack app.kubernetes.io/version: 40.0.0 chart: kube-prometheus-stack-40.0.0 heritage: Helm release: prometheus name: prometheus-kube-prometheus-node-exporter namespace: monitoring resourceVersion: "8740458" uid: c0a48da3-f7dd-4677-8ed5-2339e5d8d8c1 spec: groups: - name: node-exporter rules: - alert: NodeFilesystemSpaceFillingUp annotations: description: Filesystem on {{ $labels.device }} at {{ $labels.instance }} has only {{ printf "%.2f" $value }}% available space left and is filling up. runbook_url: https://runbooks.prometheus-operator.dev/runbooks/node/nodefilesystemspacefillingup summary: Filesystem is predicted to run out of space within the next 24 hours. expr: |- ( node_filesystem_avail_bytes{job="node-exporter",fstype!=""} / node_filesystem_size_bytes{job="node-exporter",fstype!=""} * 100 < 15 and predict_linear(node_filesystem_avail_bytes{job="node-exporter",fstype!=""}[6h], 24*60*60) < 0 and node_filesystem_readonly{job="node-exporter",fstype!=""} == 0 ) for: 1h labels: severity: warning . . . -
Prometheus-operator: How to configure email notifications for alerts
This guide relates to Prometheus-operator.
Whenever an alerting rule on Prometheus starts firing, the issue is only visible either accessing Prometheus web UI or from Grafana. In case you want it to trigger email notifications as well, follow this guide.
- Create a new Secret to store your SMTP server’s authentication password (only if it requires authentication)
- Sample yaml manifest:
apiVersion: v1
data:
  password: abcde==
kind: Secret
metadata:
  name: prometheus-smtp-settings
  namespace: monitoring
type: Opaque
- Create a new AlertmanagerConfig object
- Sample yaml manifest (replace SMTP settings according to your SMTP server):
apiVersion: monitoring.coreos.com/v1alpha1
kind: AlertmanagerConfig
metadata:
  name: prometheus-alertmanager-email-configs
  namespace: monitoring
  labels:
    alertmanagerConfig: email
spec:
  route:
    groupBy: ['alertname']
    groupWait: 10s
    groupInterval: 10s
    repeatInterval: 5m
    receiver: 'email'
  receivers:
  - name: 'email'
    emailConfigs:
    - to: 'test@test.com'
      from: 'test@test.com'
      smarthost: smtp.test.com:587
      authUsername: test@test.com
      authPassword:
        name: prometheus-smtp-settings
        key: password
      requireTLS: true
Filtering alerts based on their label
In case you want to filter alerts that should be routed to the receiver (“email”, from sample above), you can add a filtering rule as child of spec.route
Sample:
. . . spec: route: groupBy: ['alertname'] groupWait: 10s groupInterval: 10s repeatInterval: 5m receiver: 'email' matchers: - severity=~"critical|warning" . . .- Restart prometheus alertmanager:
$ kubectl delete -n monitoring $(kubectl get pods -n monitoring -l alertmanager=prometheus-kube-prometheus-alertmanager -o=name)
- Create a new Secret to store your SMTP server’s authentication password (only if it requires authentication)
-
Prometheus-operator: How to add custom scrape targets
Prometheus-operator comes with pre-configured scrape targets to keep an eye on kubernetes cluster standard components. At some point, you might want to add some custom targets to monitor your application. This page shows you how to achieve it.
- Create a yaml manifest that includes all the extra custom scrape targets you want to add:
- Sample file: prometheus-additional.yaml
- job_name: "your_custom_job_name"
  static_configs:
  - targets: ["your_endpoint_providing_metrics:your_port"]
  metrics_path: "/a/b/c/metrics/application"
Target configuration settings
Value of “targets” can only be a hostname or ip address (typically: Your application pod’s Service name, e.g. podname.namespace.svc.cluster.local) and the corresponding port.
By default, in case you do NOT specify the “metrics_path”, prometheus will contact http://hostname:port/metrics
In case your application provides metrics to a different path, you must provide it as value of “metrics_path”.
- Create a Secret yaml manifest with name = additional-scrape-configs reading the content from file prometheus-additional.yaml created on step 1 above:
# kubectl create secret generic additional-scrape-configs --from-file=prometheus-additional.yaml --dry-run=client -o yaml > additional-scrape-configs.yaml
- Create a Secret using the yaml manifest generated on step 2 above and make sure to assign it to the same namespace in use by prometheus:
# kubectl apply -f additional-scrape-configs.yaml -n monitoring
- Edit your Prometheus CRD (Custom Resource Definition) and add a reference to your additional scrape configs (new block: spec.additionalScrapeConfigs):
# kubectl edit prometheus/prometheus-kube-prometheus-prometheus -n monitoring apiVersion: monitoring.coreos.com/v1 kind: Prometheus metadata: annotations: meta.helm.sh/release-name: prometheus meta.helm.sh/release-namespace: monitoring creationTimestamp: "2022-09-15T07:20:00Z" generation: 2 labels: app: kube-prometheus-stack-prometheus app.kubernetes.io/instance: prometheus app.kubernetes.io/managed-by: Helm app.kubernetes.io/part-of: kube-prometheus-stack app.kubernetes.io/version: 40.0.0 chart: kube-prometheus-stack-40.0.0 heritage: Helm release: prometheus name: prometheus-kube-prometheus-prometheus namespace: monitoring resourceVersion: "11481588" uid: 465362f4-a309-4022-94fb-62f5e22f4828 spec: additionalScrapeConfigs: key: prometheus-additional.yaml name: additional-scrape-configs . . .- Restart kube-prometheus and kube-operator pods:
# kubectl delete -n monitoring $(kubectl get pods -o=name -n monitoring -l app=kube-prometheus-stack-operator)
# kubectl delete -n monitoring $(kubectl get pods -o=name -n monitoring -l app.kubernetes.io/instance=prometheus-kube-prometheus-prometheus)
As soon as the new pods come up, metrics collected from your new targets will be accessible from Prometheus/Grafana.
- Create a yaml manifest that includes all the extra custom scrape targets you want to add:
-
Prometheus operator – how to add custom alerts
Learn how to add your custom rules to prometheus-operator running on kubernetes
Prometheus-operator comes with a set of pre-installed alerting rules, but typically you want to add extra ones, looking after your own application running on the kubernetes cluster.
This page shows you how.
- Create a new ConfigMap that includes all your new custom groups and related rules. Sample yaml manifest:
apiVersion: monitoring.coreos.com/v1 kind: PrometheusRule metadata: labels: prometheus: prometheus-kube-prometheus-prometheus role: alert-rules release: prometheus name: prometheus-test-rules namespace: monitoring spec: groups: - name: ./test.rules rules: - alert: No connections to external systems expr: (application_test_ext_system_total > 0) and (application_test_ext_system_connections_count_total == 0) for: 3m labels: severity: warning - name: ./test-ddos.rules rules: - alert: Detect anomalies on network traffic expr: (( rate(node_network_receive_packets_total[5m]) / rate(node_network_receive_packets_total[5m] offset 5m)) > 10) and ( rate(node_network_receive_packets_total[5m]) > 1000) for: 3m labels: severity: warning- Restart your prometheus master pod so that the new ConfigMap created above is loaded:
$ kubectl delete -n monitoring $(k get pods -n monitoring -o=name -l operator.prometheus.io/name=prometheus-kube-prometheus-prometheus)
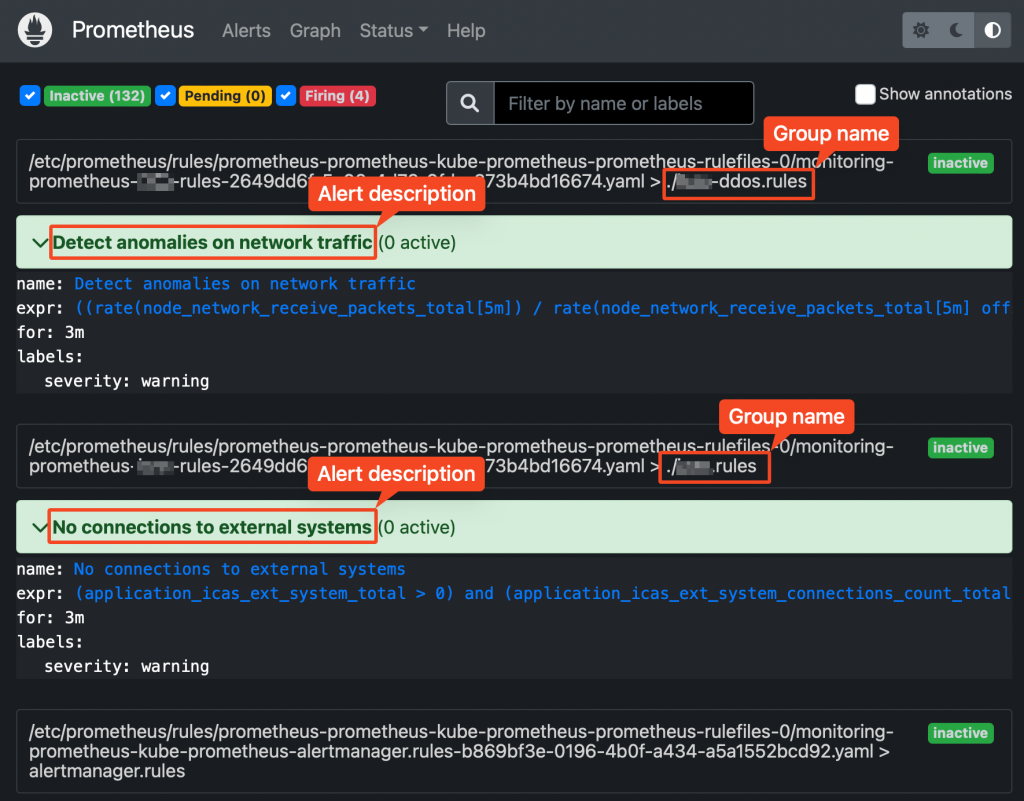
Prometheus web UI Checking rules validity
Alerting rules are going through a syntax check at prometheus core startup.
This can also be done upfront, using the “promtool” utility, part of prometheus core container.
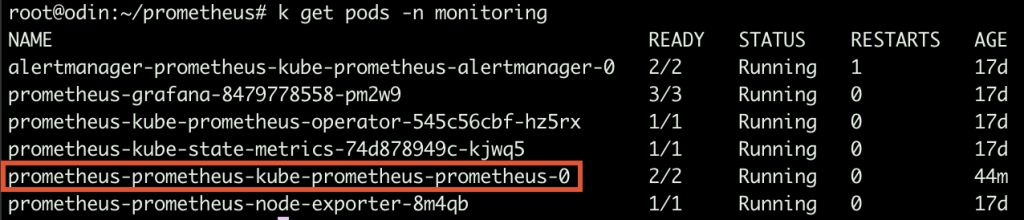
Prometheus running Pods Syntax:
$ promtool check config your_custom_rules_file.yaml
Sample rules yaml file:
groups:
- name: ./test.rules
  rules:
  - alert: No connections to external systems
    expr: (application_test_ext_system_total > 0) and (application_test_ext_system_connections_count_total == 0)
    for: 3m
    labels:
      severity: warning
- name: ./test-ddos.rules
  rules:
  - alert: Detect anomalies on network traffic
    expr: (( rate(node_network_receive_packets_total[5m]) / rate(node_network_receive_packets_total[5m] offset 5m)) > 10) and ( rate(node_network_receive_packets_total[5m]) > 1000)
    for: 3m
    labels:
      severity: warning
Prometheus does NOT check whether the metrics/labels you provide on the custom rules ConfigMap are valid and existing.
To retrieve the list of available metrics, you can create a new panel on Grafana and take advantage of auto-completion or just use the Prometheus web UI.