Grafana
-
Kubernetes observability – log aggregation – Grafana-loki deployment and configuration
Table of Contents
Intro
This page describes how to deploy and apply basic configurations – including retention policies – to a promtail-loki stack.
Loki is a log storage solution tightly integrated with Grafana. It can ingest logs from multiple sources (in our case, containers), index them and makes them accessible via Grafana UI.
Its functionalities overlap with elasticsearch. Grafana-loki is more lightweight since it indexes only entries metadata and not the entire content of each log line.
Data can be pushed into loki with multiple solutions (e.g. promtail, fluent bit, fluentd, logstash, etc.). See https://grafana.com/docs/loki/latest/clients/
This page describes how to use promtail for such purpose.
The following setup is not meant to be used on production environments.
Requirements
- A k8s cluster including Grafana
- all appropriate configurations to use kubectl command line tool
Loki deployment
- Add loki helm chart repo
helm repo add grafana https://grafana.github.io/helm-charts
helm repo update
- Create a file values.yaml to store all chart settings that must be overridden from the default values
loki: commonConfig: replication_factor: 1 storage: type: 'filesystem' compactor: working_directory: /var/loki/data/retention shared_store: filesystem compaction_interval: 10m retention_enabled: true retention_delete_delay: 2h retention_delete_worker_count: 150 schema_config: configs: - from: "2022-12-01" index: period: 24h prefix: loki_index_ object_store: filesystem schema: v11 store: boltdb-shipper storage_config: boltdb_shipper: active_index_directory: /var/loki/data/index cache_location: /var/loki/data/boltdb-cache shared_store: filesystem limits_config: retention_period: 24h write: replicas: 1 read: replicas: 1- Create the namespace
kubectl create namespace loki
- Create 2 PersistentVolumes that will be used by loki read / write components
apiVersion: v1 kind: PersistentVolume metadata: name: loki-pv-1 namespace: loki spec: accessModes: - ReadWriteOnce capacity: storage: 10Gi persistentVolumeReclaimPolicy: Retain local: path: [YOUR_NODE_LOCAL_STORAGE_FOLDER_1] nodeAffinity: required: nodeSelectorTerms: - matchExpressions: - key: kubernetes.io/hostname operator: In values: - [YOUR_NODE_NAME] --- apiVersion: v1 kind: PersistentVolume metadata: name: loki-pv-2 namespace: loki spec: accessModes: - ReadWriteOnce capacity: storage: 10Gi persistentVolumeReclaimPolicy: Retain local: path: [YOUR_NODE_LOCAL_STORAGE_FOLDER_2] nodeAffinity: required: nodeSelectorTerms: - matchExpressions: - key: kubernetes.io/hostname operator: In values: - [YOUR_NODE_NAME]- Install the helm chart
helm install --values values.yaml loki --namespace=loki grafana/loki-simple-scalable
Once all components are started up, you should have the following scenario:
[rockylinux@test-vm grafana-loki]$ kubectl get all -n loki
NAME                                               READY   STATUS    RESTARTS   AGE
pod/loki-gateway-55fccf8654-vcxqt                  1/1     Running   0          23h
pod/loki-grafana-agent-operator-684b478b77-vwh9g   1/1     Running   0          23h
pod/loki-logs-wwcp5                                2/2     Running   0          23h
pod/loki-read-0                                    1/1     Running   0          32m
pod/loki-write-0                                   1/1     Running   0          32m

NAME                          TYPE        CLUSTER-IP       EXTERNAL-IP   PORT(S)             AGE
service/loki-gateway          ClusterIP   10.106.191.67    <none>        80/TCP              23h
service/loki-memberlist       ClusterIP   None             <none>        7946/TCP            23h
service/loki-read             ClusterIP   10.103.120.150   <none>        3100/TCP,9095/TCP   23h
service/loki-read-headless    ClusterIP   None             <none>        3100/TCP,9095/TCP   23h
service/loki-write            ClusterIP   10.98.226.44     <none>        3100/TCP,9095/TCP   23h
service/loki-write-headless   ClusterIP   None             <none>        3100/TCP,9095/TCP   23h

NAME                       DESIRED   CURRENT   READY   UP-TO-DATE   AVAILABLE   NODE SELECTOR   AGE
daemonset.apps/loki-logs   1         1         1       1            1           <none>          23h

NAME                                          READY   UP-TO-DATE   AVAILABLE   AGE
deployment.apps/loki-gateway                  1/1     1            1           23h
deployment.apps/loki-grafana-agent-operator   1/1     1            1           23h

NAME                                                     DESIRED   CURRENT   READY   AGE
replicaset.apps/loki-gateway-55fccf8654                  1         1         1       23h
replicaset.apps/loki-grafana-agent-operator-684b478b77   1         1         1       23h

NAME                          READY   AGE
statefulset.apps/loki-read    1/1     23h
statefulset.apps/loki-write   1/1     23h
Promtail deployment
Promtail tails log files and pushed them into loki.
To deploy all required components, apply the following yaml:
--- # Daemonset.yaml
apiVersion: apps/v1
kind: DaemonSet
metadata:
  name: promtail-daemonset
spec:
  selector:
    matchLabels:
      name: promtail
  template:
    metadata:
      labels:
        name: promtail
    spec:
      serviceAccount: promtail-serviceaccount
      containers:
      - name: promtail-container
        image: grafana/promtail
        args:
        - -config.file=/etc/promtail/promtail.yaml
        env:
        - name: 'HOSTNAME' # needed when using kubernetes_sd_configs
          valueFrom:
            fieldRef:
              fieldPath: 'spec.nodeName'
        volumeMounts:
        - name: logs
          mountPath: /var/log
        - name: promtail-config
          mountPath: /etc/promtail
        - mountPath: /var/lib/docker/containers
          name: varlibdockercontainers
          readOnly: true
      volumes:
      - name: logs
        hostPath:
          path: /var/log
      - name: varlibdockercontainers
        hostPath:
          path: /var/lib/docker/containers
      - name: promtail-config
        configMap:
          name: promtail-config
--- # Daemonset.yaml
apiVersion: apps/v1
kind: DaemonSet
metadata:
  name: promtail-daemonset
spec:
  selector:
    matchLabels:
      name: promtail
  template:
    metadata:
      labels:
        name: promtail
    spec:
      serviceAccount: promtail-serviceaccount
      containers:
      - name: promtail-container
        image: grafana/promtail
        args:
        - -config.file=/etc/promtail/promtail.yaml
        env:
        - name: 'HOSTNAME' # needed when using kubernetes_sd_configs
          valueFrom:
            fieldRef:
              fieldPath: 'spec.nodeName'
        volumeMounts:
        - name: logs
          mountPath: /var/log
        - name: promtail-config
          mountPath: /etc/promtail
        - mountPath: /var/lib/docker/containers
          name: varlibdockercontainers
          readOnly: true
      volumes:
      - name: logs
        hostPath:
          path: /var/log
      - name: varlibdockercontainers
        hostPath:
          path: /var/lib/docker/containers
      - name: promtail-config
        configMap:
          name: promtail-config -- # configmap.yaml
apiVersion: v1
kind: ConfigMap
metadata:
  name: promtail-config
data:
  promtail.yaml: |
    server:
      http_listen_port: 9080
      grpc_listen_port: 0

    clients:
      - url: http://loki-write.loki.svc.cluster.local:3100/loki/api/v1/push
        tenant_id: 1

    positions:
      filename: /tmp/positions.yaml
    target_config:
      sync_period: 10s
    scrape_configs:
    - job_name: pod-logs
      kubernetes_sd_configs:
        - role: pod
      pipeline_stages:
        - docker: {}
      relabel_configs:
        - source_labels:
            - __meta_kubernetes_pod_node_name
          target_label: __host__
        - action: labelmap
          regex: __meta_kubernetes_pod_label_(.+)
        - action: replace
          replacement: $1
          separator: /
          source_labels:
            - __meta_kubernetes_namespace
            - __meta_kubernetes_pod_name
          target_label: job
--- # Daemonset.yaml
apiVersion: apps/v1
kind: DaemonSet
metadata:
  name: promtail-daemonset
spec:
  selector:
    matchLabels:
      name: promtail
  template:
    metadata:
      labels:
        name: promtail
    spec:
      serviceAccount: promtail-serviceaccount
      containers:
      - name: promtail-container
        image: grafana/promtail
        args:
        - -config.file=/etc/promtail/promtail.yaml
        env:
        - name: 'HOSTNAME' # needed when using kubernetes_sd_configs
          valueFrom:
            fieldRef:
              fieldPath: 'spec.nodeName'
        volumeMounts:
        - name: logs
          mountPath: /var/log
        - name: promtail-config
          mountPath: /etc/promtail
        - mountPath: /var/lib/docker/containers
          name: varlibdockercontainers
          readOnly: true
      volumes:
      - name: logs
        hostPath:
          path: /var/log
      - name: varlibdockercontainers
        hostPath:
          path: /var/lib/docker/containers
      - name: promtail-config
        configMap:
          name: promtail-config -- # configmap.yaml
apiVersion: v1
kind: ConfigMap
metadata:
  name: promtail-config
data:
  promtail.yaml: |
    server:
      http_listen_port: 9080
      grpc_listen_port: 0

    clients:
      - url: http://loki-write.loki.svc.cluster.local:3100/loki/api/v1/push
        tenant_id: 1

    positions:
      filename: /tmp/positions.yaml
    target_config:
      sync_period: 10s
    scrape_configs:
    - job_name: pod-logs
      kubernetes_sd_configs:
        - role: pod
      pipeline_stages:
        - docker: {}
      relabel_configs:
        - source_labels:
            - __meta_kubernetes_pod_node_name
          target_label: __host__
        - action: labelmap
          regex: __meta_kubernetes_pod_label_(.+)
        - action: replace
          replacement: $1
          separator: /
          source_labels:
            - __meta_kubernetes_namespace
            - __meta_kubernetes_pod_name
          target_label: job         - action: replace
          source_labels:
            - __meta_kubernetes_namespace
          target_label: namespace
        - action: replace
          source_labels:
            - __meta_kubernetes_pod_name
          target_label: pod
        - action: replace
          source_labels:
            - __meta_kubernetes_pod_container_name
          target_label: container
        - replacement: /var/log/pods/*$1/*.log
          separator: /
          source_labels:
            - __meta_kubernetes_pod_uid
            - __meta_kubernetes_pod_container_name
          target_label: __path__
--- # Clusterrole.yaml
apiVersion: rbac.authorization.k8s.io/v1
kind: ClusterRole
metadata:
  name: promtail-clusterrole
rules:
  - apiGroups: [""]
    resources:
    - nodes
    - services
    - pods
    verbs:
    - get
    - watch
    - list

--- # ServiceAccount.yaml
apiVersion: v1
kind: ServiceAccount
metadata:
  name: promtail-serviceaccount

--- # Rolebinding.yaml
apiVersion: rbac.authorization.k8s.io/v1
kind: ClusterRoleBinding
metadata:
  name: promtail-clusterrolebinding
subjects:
    - kind: ServiceAccount
      name: promtail-serviceaccount
      namespace: default
roleRef:
    kind: ClusterRole
    name: promtail-clusterrole
    apiGroup: rbac.authorization.k8s.io
Loki datasource configuration on Grafana admin UI
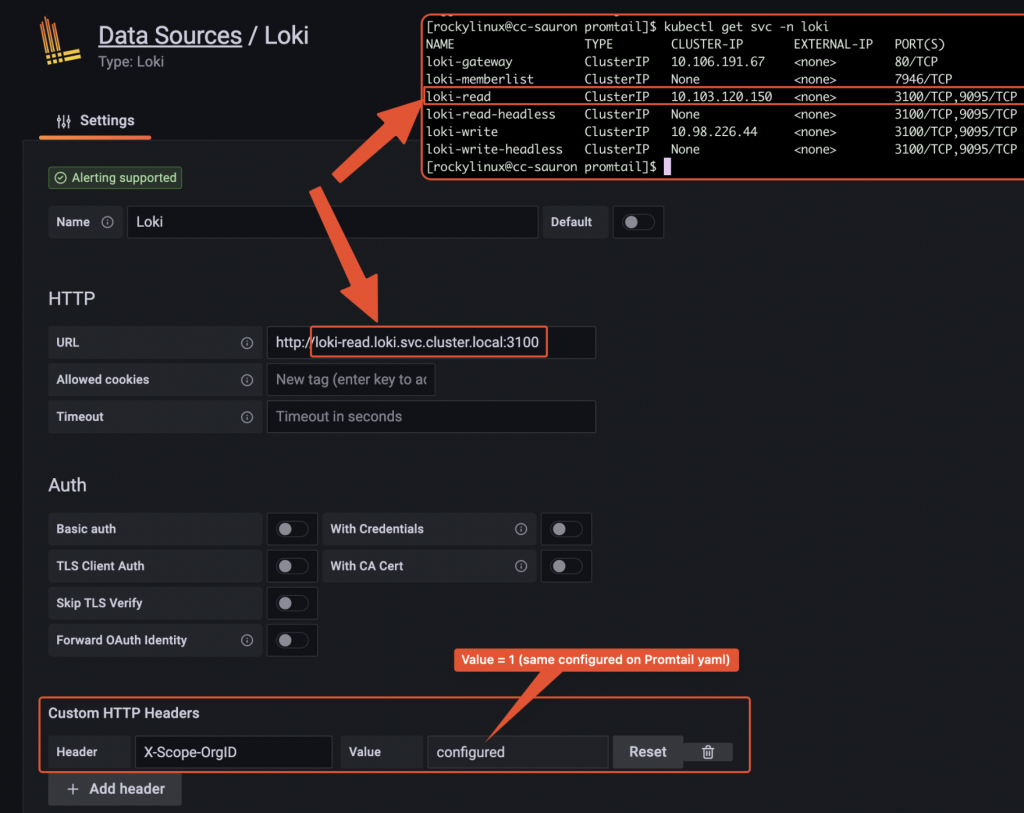
Datasource configuration on Grafana Browsing logs from Grafana UI
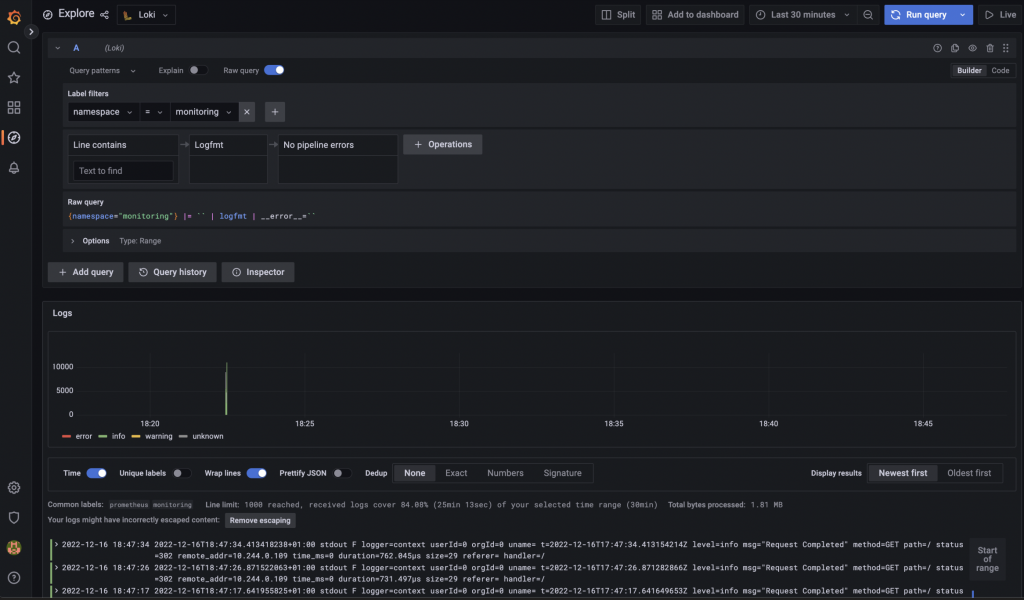
Data browser on Grafana -
Monitoring application health with blackbox-exporter
Prometheus standard deployment and configuration has already been discussed on other posts, but what if you want to expose metrics about your custom application stack health? This page explains how to achieve this, by taking advantage of blackbox-exporter, so that your application components running on a kubernetes cluster will be easily monitored.
Intro
Generally speaking, blackbox stands in between your Prometheus instance and your custom application components: Prometheus fetches metrics asking blackbox to target custom endpoints. Response will be given back using the format expected by Prometheus. Endspoints are typically your cluster’s Pods, Services and Ingresses.
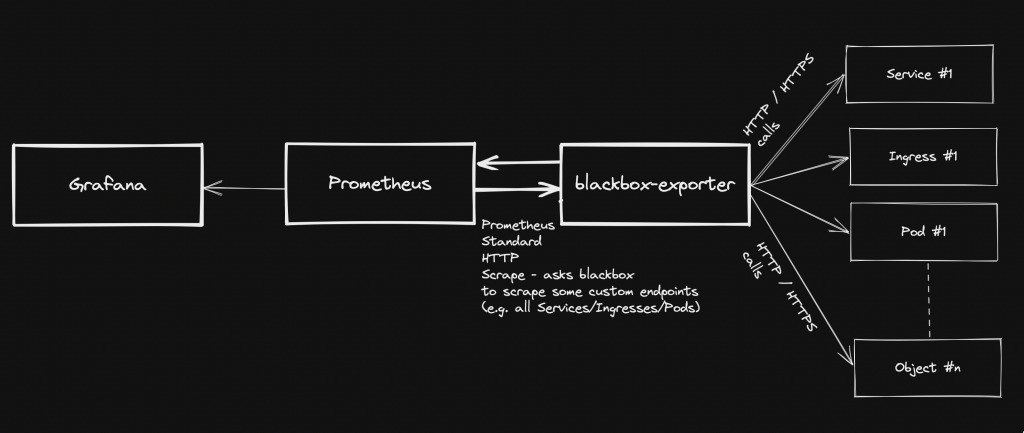
Overview Pre-requirements
- A kubernetes cluster with kubectl configured to interact with it
- Prometheus-operator stack – see https://github.com/prometheus-operator/prometheus-operator
- Grafana (part of Prometheus-operator)
blackbox-exporter installation (via helm chart)
- Add the helm repo
helm repo add prometheus-community https://prometheus-community.github.io/helm-charts
help repo update
- Create a file: values.yaml
config: modules: http_2xx: prober: http timeout: 5s http: valid_http_versions: ["HTTP/1.1", "HTTP/2.0"] follow_redirects: true preferred_ip_protocol: "ip4"- Install the helm chart (in this case, we are using “monitoring” namespace):
helm install prometheus-blackbox prometheus-community/prometheus-blackbox-exporter -n monitoring -f values.yaml
Adding custom scrape targets to blackbox
As regards how to add extra scrape targets, see https://matteorenzi.com/2022/10/08/prometheus-operator-how-to-add-custom-scrape-targets/
Below some sample targets that you might want to add:
Probing external targets (sample: www.google.com)
- job_name: 'blackbox-external-targets'
  metrics_path: /probe
  params:
    module: [http_2xx]
  static_configs:
    - targets:
      - https://www.google.com
  relabel_configs:
    - source_labels: [__address__]
      target_label: __param_target
    - source_labels: [__param_target]
      target_label: instance
    - target_label: __address__
      replacement: prometheus-blackbox-prometheus-blackbox-exporter.monitoring.svc.cluster.local:9115
Probing your cluster Services
- job_name: "blackbox-kubernetes-services"
  metrics_path: /probe
  params:
    module: [http_2xx]
  kubernetes_sd_configs:
  - role: service
  relabel_configs:
    - source_labels: [__address__]
      target_label: __param_target
    - target_label: __address__
      replacement:  prometheus-blackbox-prometheus-blackbox-exporter.monitoring.svc.cluster.local:9115
    - source_labels: [__param_target]
      target_label: instance
    - action: labelmap
      regex: __meta_kubernetes_service_label_(.+)
    - source_labels: [__meta_kubernetes_namespace]
      target_label: kubernetes_namespace
    - source_labels: [__meta_kubernetes_service_name]
      target_label: kubernetes_service_name
Probing cluster Ingresses
- job_name: "blackbox-kubernetes-ingresses"
  metrics_path: /probe
  params:
    module: [http_2xx]
  kubernetes_sd_configs:
  - role: ingress
  relabel_configs:
    - source_labels:
        [
          __meta_kubernetes_ingress_scheme,
          __address__,
          __meta_kubernetes_ingress_path,
        ]
      regex: (.+);(.+);(.+)
      replacement: ://
      target_label: __param_target
    - target_label: __address__
      replacement: prometheus-blackbox-prometheus-blackbox-exporter.monitoring.svc.cluster.local:9115
    - source_labels: [__param_target]
      target_label: instance
    - action: labelmap
      regex: __meta_kubernetes_ingress_label_(.+)
    - source_labels: [__meta_kubernetes_namespace]
      target_label: kubernetes_namespace
    - source_labels: [__meta_kubernetes_ingress_name]
      target_label: ingress_name
Probing cluster Pods
- job_name: "blackbox-kubernetes-pods"
  metrics_path: /probe
  params:
    module: [http_2xx]
  kubernetes_sd_configs:
  - role: pod
  relabel_configs:
    - source_labels: [__address__]
      target_label: __param_target
    - target_label: __address__
      replacement: prometheus-blackbox-prometheus-blackbox-exporter.monitoring.svc.cluster.local:9115
    - source_labels: [__param_target]
      replacement: /health
      target_label: instance
    - action: labelmap
      regex: __meta_kubernetes_pod_label_(.+)
    - source_labels: [__meta_kubernetes_namespace]
      target_label: kubernetes_namespace
    - source_labels: [__meta_kubernetes_pod_name]
      target_label: kubernetes_pod_name
Checking new targets / probes
Once the new scraping targets have been applied, they must be visible on Prometheus: Status -> Targets
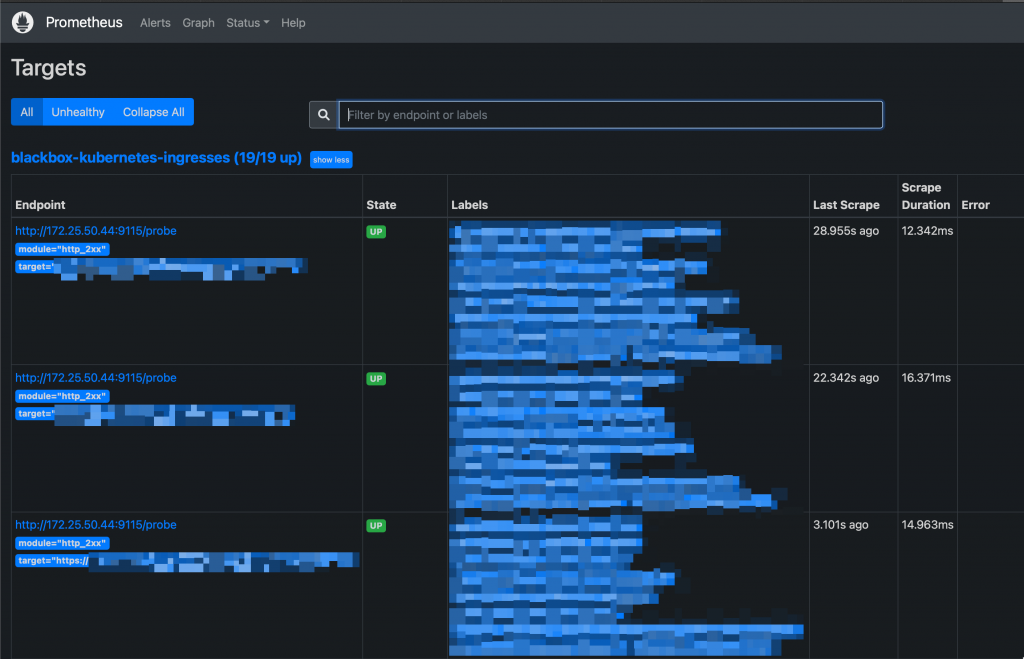
New Targets on Prometheus UI Probes can be queried like this:
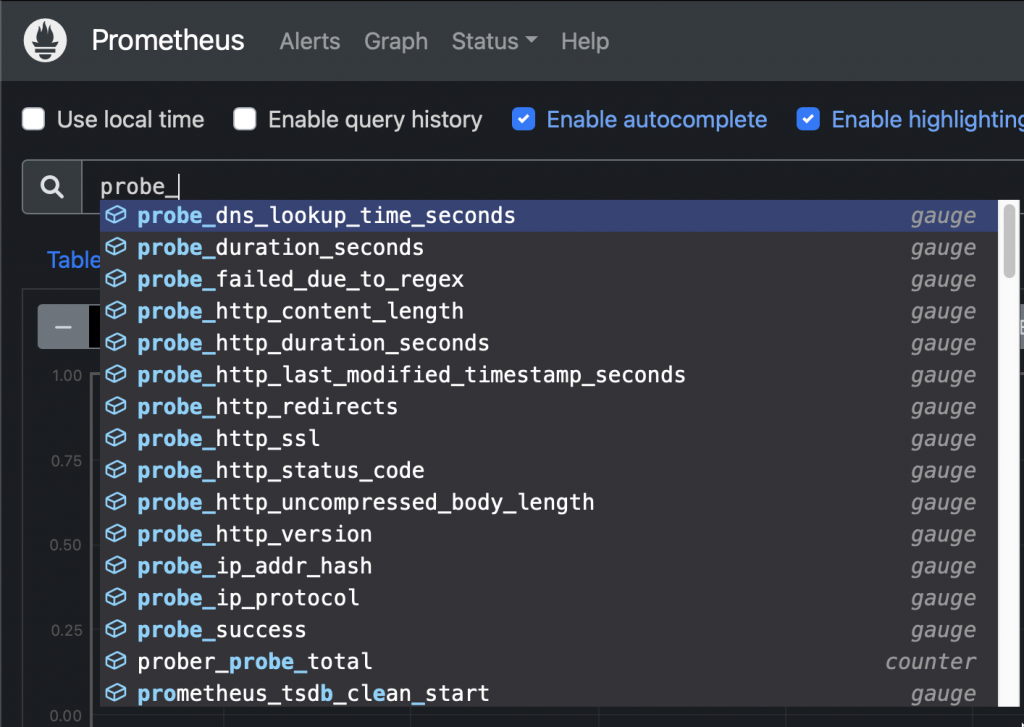
New probes Sample query: Check HTTP status code from an ingress:
probe_http_status_code{ingress_name="xxxxx"}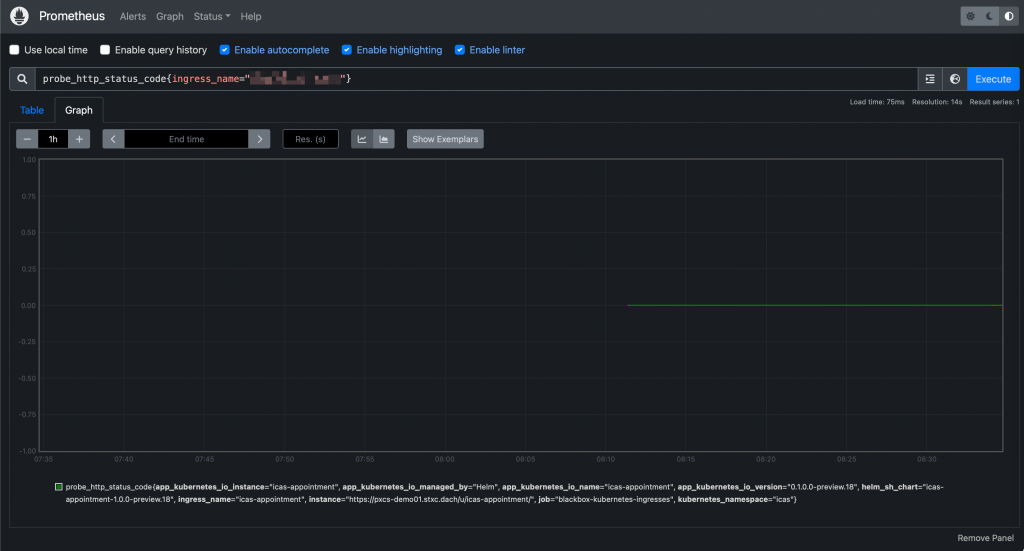
Prometheus UI: Querying a probe And they will be accessible from Grafana as well:
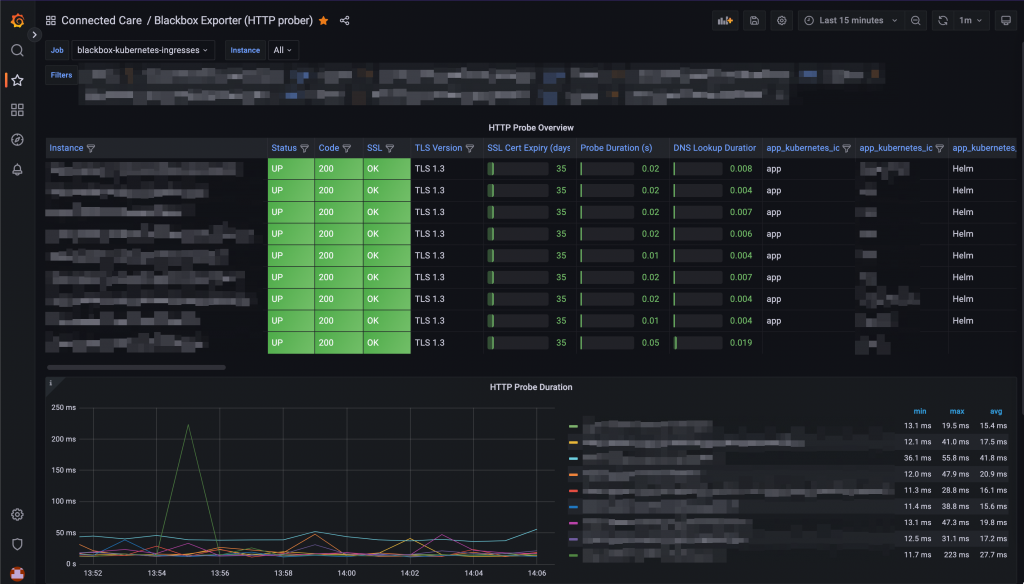
Probes visualisation on a Grafana dashboard -
Grafana running on kubernetes: How to configure SMTP integration
Grafana has a built-in alerting system and it can be used to trigger email notifications whenever an alert is raised. This page shows you how to configure the integration with an external SMTP server.
- Create a ConfigMap that includes the grafana.ini main configuration file
- Sample ConfigMap yaml manifest:
apiVersion: v1 data: grafana.ini: | [analytics] check_for_updates = true [grafana_net] url = https://grafana.net [log] mode = console [paths] data = /var/lib/grafana/ logs = /var/log/grafana plugins = /var/lib/grafana/plugins provisioning = /etc/grafana/provisioning [server] domain = [smtp] enabled = true host = smtp.test.com:587 user = test@test.com password = xxxxxxxxx startTLS_policy = MandatoryStartTLS skip_verify = true from_address = test@test.com from_name = Grafana kind: ConfigMap metadata: annotations: meta.helm.sh/release-name: prometheus meta.helm.sh/release-namespace: monitoring labels: app.kubernetes.io/instance: prometheus app.kubernetes.io/managed-by: Helm app.kubernetes.io/name: grafana app.kubernetes.io/version: 9.1.4 helm.sh/chart: grafana-6.38.0 name: prometheus-grafana namespace: monitoring- Restart grafana pod(s) to apply the new config described above:
# kubectl delete -n monitoring $(kubectl get pods -n monitoring -o=name -l app.kubernetes.io/name=grafana)
- Create a ConfigMap that includes the grafana.ini main configuration file


