DevOps
-
Prometheus-operator: How to add custom scrape targets
Prometheus-operator comes with pre-configured scrape targets to keep an eye on kubernetes cluster standard components. At some point, you might want to add some custom targets to monitor your application. This page shows you how to achieve it.
- Create a yaml manifest that includes all the extra custom scrape targets you want to add:
- Sample file: prometheus-additional.yaml
- job_name: "your_custom_job_name"
  static_configs:
  - targets: ["your_endpoint_providing_metrics:your_port"]
  metrics_path: "/a/b/c/metrics/application"
Target configuration settings
Value of “targets” can only be a hostname or ip address (typically: Your application pod’s Service name, e.g. podname.namespace.svc.cluster.local) and the corresponding port.
By default, in case you do NOT specify the “metrics_path”, prometheus will contact http://hostname:port/metrics
In case your application provides metrics to a different path, you must provide it as value of “metrics_path”.
- Create a Secret yaml manifest with name = additional-scrape-configs reading the content from file prometheus-additional.yaml created on step 1 above:
# kubectl create secret generic additional-scrape-configs --from-file=prometheus-additional.yaml --dry-run=client -o yaml > additional-scrape-configs.yaml
- Create a Secret using the yaml manifest generated on step 2 above and make sure to assign it to the same namespace in use by prometheus:
# kubectl apply -f additional-scrape-configs.yaml -n monitoring
- Edit your Prometheus CRD (Custom Resource Definition) and add a reference to your additional scrape configs (new block: spec.additionalScrapeConfigs):
# kubectl edit prometheus/prometheus-kube-prometheus-prometheus -n monitoring apiVersion: monitoring.coreos.com/v1 kind: Prometheus metadata: annotations: meta.helm.sh/release-name: prometheus meta.helm.sh/release-namespace: monitoring creationTimestamp: "2022-09-15T07:20:00Z" generation: 2 labels: app: kube-prometheus-stack-prometheus app.kubernetes.io/instance: prometheus app.kubernetes.io/managed-by: Helm app.kubernetes.io/part-of: kube-prometheus-stack app.kubernetes.io/version: 40.0.0 chart: kube-prometheus-stack-40.0.0 heritage: Helm release: prometheus name: prometheus-kube-prometheus-prometheus namespace: monitoring resourceVersion: "11481588" uid: 465362f4-a309-4022-94fb-62f5e22f4828 spec: additionalScrapeConfigs: key: prometheus-additional.yaml name: additional-scrape-configs . . .- Restart kube-prometheus and kube-operator pods:
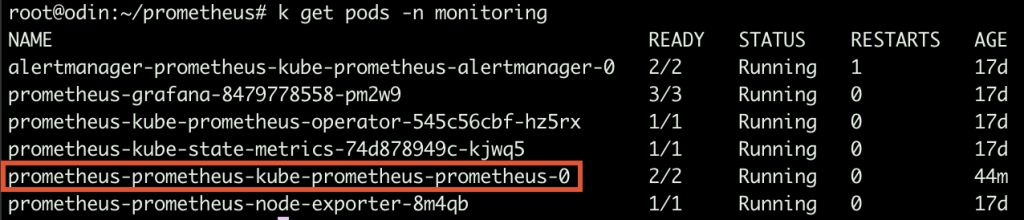
# kubectl delete -n monitoring $(kubectl get pods -o=name -n monitoring -l app=kube-prometheus-stack-operator)
# kubectl delete -n monitoring $(kubectl get pods -o=name -n monitoring -l app.kubernetes.io/instance=prometheus-kube-prometheus-prometheus)
As soon as the new pods come up, metrics collected from your new targets will be accessible from Prometheus/Grafana.
- Create a yaml manifest that includes all the extra custom scrape targets you want to add:
-
Prometheus operator – how to add custom alerts
Learn how to add your custom rules to prometheus-operator running on kubernetes
Prometheus-operator comes with a set of pre-installed alerting rules, but typically you want to add extra ones, looking after your own application running on the kubernetes cluster.
This page shows you how.
- Create a new ConfigMap that includes all your new custom groups and related rules. Sample yaml manifest:
apiVersion: monitoring.coreos.com/v1 kind: PrometheusRule metadata: labels: prometheus: prometheus-kube-prometheus-prometheus role: alert-rules release: prometheus name: prometheus-test-rules namespace: monitoring spec: groups: - name: ./test.rules rules: - alert: No connections to external systems expr: (application_test_ext_system_total > 0) and (application_test_ext_system_connections_count_total == 0) for: 3m labels: severity: warning - name: ./test-ddos.rules rules: - alert: Detect anomalies on network traffic expr: (( rate(node_network_receive_packets_total[5m]) / rate(node_network_receive_packets_total[5m] offset 5m)) > 10) and ( rate(node_network_receive_packets_total[5m]) > 1000) for: 3m labels: severity: warning- Restart your prometheus master pod so that the new ConfigMap created above is loaded:
$ kubectl delete -n monitoring $(k get pods -n monitoring -o=name -l operator.prometheus.io/name=prometheus-kube-prometheus-prometheus)
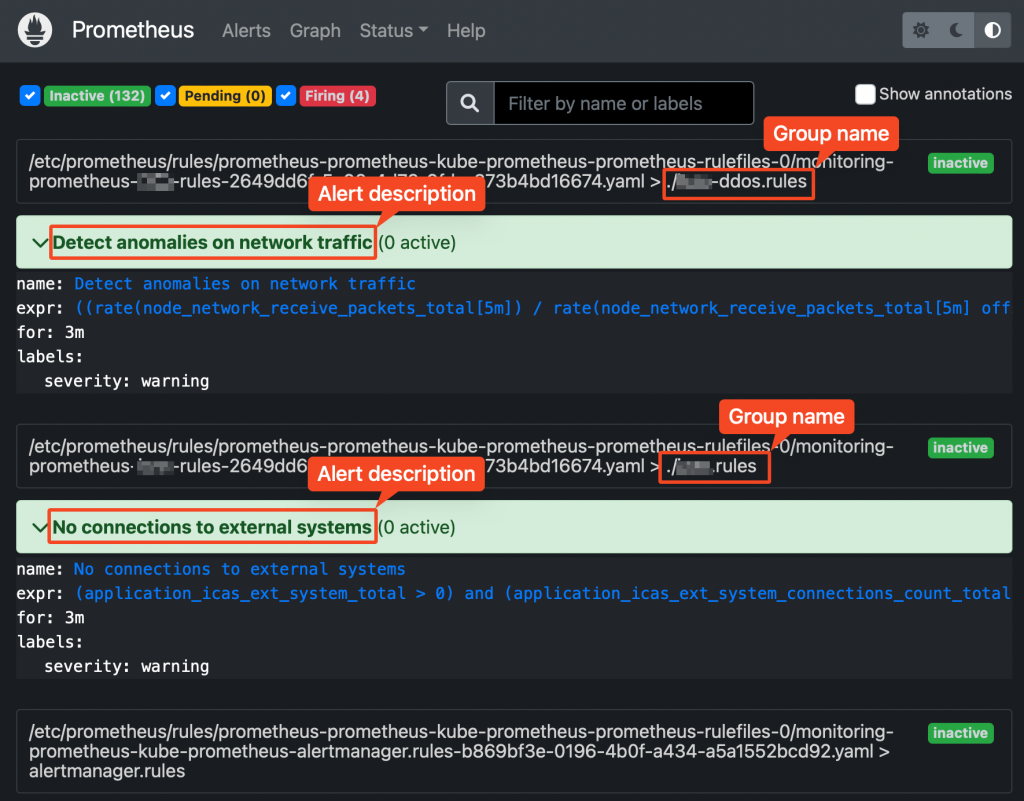
Prometheus web UI Checking rules validity
Alerting rules are going through a syntax check at prometheus core startup.
This can also be done upfront, using the “promtool” utility, part of prometheus core container.
Prometheus running Pods Syntax:
$ promtool check config your_custom_rules_file.yaml
Sample rules yaml file:
groups:
- name: ./test.rules
  rules:
  - alert: No connections to external systems
    expr: (application_test_ext_system_total > 0) and (application_test_ext_system_connections_count_total == 0)
    for: 3m
    labels:
      severity: warning
- name: ./test-ddos.rules
  rules:
  - alert: Detect anomalies on network traffic
    expr: (( rate(node_network_receive_packets_total[5m]) / rate(node_network_receive_packets_total[5m] offset 5m)) > 10) and ( rate(node_network_receive_packets_total[5m]) > 1000)
    for: 3m
    labels:
      severity: warning
Prometheus does NOT check whether the metrics/labels you provide on the custom rules ConfigMap are valid and existing.
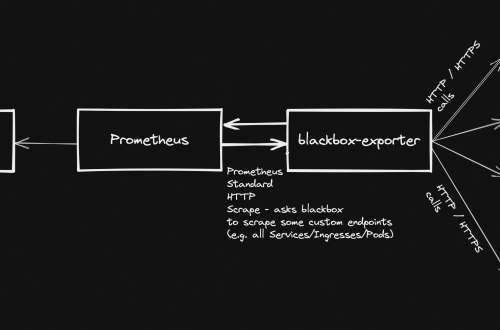
To retrieve the list of available metrics, you can create a new panel on Grafana and take advantage of auto-completion or just use the Prometheus web UI.
-
(My) kubectl cheatsheet
Table of Contents
General purpose
# Lists all configured contexts
kubectl config get-contexts

# Changes the default namespace
kubectl config set-context --current --namespace=namespace_name

# Elects a node as worker
kubectl label node node_name node-role.kubernetes.io/worker=worker

# Removes taint from node, the "-" at end of node role means "untaint" rather than "taint"
kubectl taint node node_name node-role.kubernetes.io/control-plane-
Fetching objects info
# lists all pods on default namespace showing only their name
Kubectl get pods -o=name

# lists all pods on default namespace showing a custom list of attributes and setting columns names
k get pods -o=custom-columns="NAME:.metadata.name,STATUS:.status.phase"
Executing pods
# Creates and outputs to the console (as YAML) the code to create a pod running image-nginx
kubectl run --image=nginx --dry-run=client -o yaml mypod

# Gives you access to the shell (bash) of container container_name running into pod pod_name
kubectl exec -it [container_name] pod_name -- bash

# Creates and runs a pod with container image = nginx
kubectl run --image=nginx mypod
Networking
# forwards requests from port 16686 (node) to port 16686 (cluster) accepting requests from all network interfaces (param --address 0.0.0.0
kubectl port-forward --address 0.0.0.0  $(kubectl get pods -l=app="jaeger" -o name) 16686:16686
Accessing pod logs
# stream logs from pod pod_name on namespace ns
kubectl logs -f -n ns pods/pod_name

# stream logs from pod pod_name on namespace ns newer than a relative duration
kubectl logs --since=1h -n ns pods/pod_name

# return logs after a specific date (pod=pod_name, namespace=ns)
kubectl logs --since-time=2020-08-13T10:46:00.000000000Z -n ns pods/pod_name

# print the logs for the previous instance of the container (pod=pod_name, namespace=ns)
kubectl logs --previous -n ns pods/pod_name

# print the logs of this container (pod=pod_name, namespace=ns)
kubectl logs -c -n ns pods/pod_name

# print all events in chronological order (pod=pod_name, namespace=ns)
kubectl get events --sort-by=’.metadata.creationTimestamp’ -n ns pods/pod_name

# print pod details like status or recent events (pod=pod_name, namespace=ns)
kubectl describe pod -n ns pods/pod_name

# multi-container pod, selects logs from a specific container (pod=pod_name, namespace=ns)
kubectl logs -c container_name pod_name -n ns pods/pod_name
-
Kubernetes Distributed Tracing (Jaeger)
Table of Contents
Overview
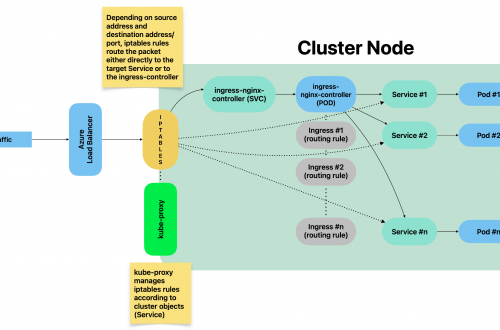
Jaeger is a tool to trace requests within an application distributed over a kubernetes cluster.
It requires to deploy a sidecar container within each pod running the application we want to monitor.
The sidecar container (jaeger-agent) will collect data from the pod and send the same to the jaeger-server (running on a dedicated pod).
Installation
Requirements
- Deploy an ingress-controller
helm upgrade --install ingress-nginx ingress-nginx --repo https://kubernetes.github.io/ingress-nginx --namespace ingress-nginx --create-namespa
- Deploy a cert-manager (check latest release available here: https://github.com/cert-manager/cert-manager)
kubectl apply -f https://github.com/cert-manager/cert-manager/releases/download/v1.6.3/cert-manager.yaml
- Create namespace observability
kubectl create namespace observability
- Deploy observability operator (check latest version available here: https://github.com/jaegertracing/jaeger-operator/tree/main)
kubectl create -f https://github.com/jaegertracing/jaeger-operator/releases/download/v1.36.0/jaeger-operator.yaml -n observability
- Create a resource implementing the operator created on step above
kubectl apply -f - <<EOF
apiVersion: jaegertracing.io/v1
kind: Jaeger
metadata:
  name: simplest
EOF
The following objects must be available in the cluster once installation is successfully completed:
[root@mr-k8s-demo1 ~]# k get all -n observability
NAME                                  READY   STATUS    RESTARTS   AGE
pod/jaeger-operator-f9d5b7569-9px49   2/2     Running   0          2d23h

NAME                                      TYPE        CLUSTER-IP      EXTERNAL-IP   PORT(S)    AGE
service/jaeger-operator-metrics           ClusterIP   10.98.4.211     <none>        8443/TCP   2d23h
service/jaeger-operator-webhook-service   ClusterIP   10.97.240.143   <none>        443/TCP    2d23h

NAME                              READY   UP-TO-DATE   AVAILABLE   AGE
deployment.apps/jaeger-operator   1/1     1            1           2d23h

NAME                                        DESIRED   CURRENT   READY   AGE
replicaset.apps/jaeger-operator-f9d5b7569   1         1         1       2d23h
Configuring app to be monitored
The app that needs to be monitored must implement open-tracing tracer initialization.
Implementation differs depending on the language/framework in use.
Jaeger agent, running as sidecar, can be injected by adding the following annotation:
apiVersion:apps/v1
kind:Deployment
metadata:name:test-app
  labels:name:test-app
  annotations:"sidecar.jaegertracing.io/inject":"true"
Accessing jaeger web console
Jaeger server is by default available on port 16686.
For testing / occasional monitoring purposes, the port can be made available using kubernetes’ built-in port-forward:
kubectl port-forward --address 0.0.0.0 $(kubectl get pods -l=app="jaeger" -o name) 16686:16686
From this moment, jaeger web UI is accessible at http://k8s_host_ip_address:16686
-
Docker cheatsheet
Table of Contents
Generic
Command Description docker exec -ti CONTAINER_ID command_to_execute Runs, interactive mode, a command over a container already running (e.g. starts the shell, /bin/sh) docker rmi IMAGE_NAME Deletes the image (all existing containers based on this image must have been stopped and deleted upfront) docker rm CONTAINER_ID Deletes the container docker stop CONTAINER_ID Stops the container docker inspect CONTAINER_ID Lists all attributes of container with id CONTAINER_ID Generic docker commands
Networking
Command Description docker network list Lists all configured networks docker inspect NETWORK_ID Displays all attributes of network with id NETWORK_ID docker run
–name alpine-2
–network=none alpineRuns a new container with name = alpine-2 and attachs it to network “none”, using image name = alpine docker network create
–driver bridge
–subnet 182.18.0.1/24
–gateway 182.18.0.1
wp-mysql-networkCreates a new network with type = bridge, subnet 182.18.0.1/24 and gateway 182.18.0.1. Network name will be wp-mysql-network docker run
-d
-e MYSQL_ROOT_PASSWORD=db_pass123
–name mysql-db
–network wp-mysql-network mysql:5.6Runs a new container (detached mode) assigning an environment variable MYSQL_ROOT_PASSWORD=db_pass123 and container name = mysql-db. The container will be attached to the network with name wp-mysql-network. Image used to run the container: mysql:5.6 docker run –network=wp-mysql-network
-e DB_Host=mysql-db -e DB_Password=db_pass123
-p 38080:8080
–name webapp
–link mysql-db:mysql-db
-d
kodekloud/simple-webapp-mysqlRuns a new container from image kodekloud/simple-webapp-mysql and with name webapp.Container gets attached to network with name wp-mysql-network 2 environment variables are defined Internal (container) network port 8080 is exposed to port 38080 (host) The container gets linked to container with name mysql-db Runs in detached mode Docker networking most common commands
Storage Management
Command Description docker run -v /opt/data:/var/lib/mysql
-d –name mysql-db
-e MYSQL_ROOT_PASSWORD=db_pass123 mysqlRuns a new container in detached mode and with name mysql-dbMaps the container directory /var/lib/mysql over the host directory /opt/data (bind-mounting) Sets an environment variable Uses the image with name mysql alternative using –mount option (rather than -v) docker run –mount type=bind,source=/opt/data,target=/var/lib/mysql mysql docker volume create data_volume Creates a new persisted volume named as data_volume (will be a new folder at /var/lib/docker/volumes into host file system) and runs a new container mapping the persisted volume to /var/lib/mysql docker run -v data_volume:/var/lib/mysql mysql Docker storage management useful commands
Docker image build
Docker file sample:
FROM Ubuntu	Each statement is a layer with its space usage
RUN apt-get update && apt-get -y install python
RUN pip install flask flask-mysql
COPY . /opt/source/code
ENTRYPOINT FLASK_APP=/opt/source-code/app.py flask run
Command to be issues in order to create an image:
docker build Dockerfile -t username/app-name
Docker registry management
Command Description docker run -d -p 5000:5000 –name registry registry:2 Creates a new local registry docker image tag my-image localhost:5000/my-image Tagging an image so that it gets stored on the local registry docker push localhost:5000/my-image Pushing an image to the local registry docker pull localhost:5000/my-image Pulling an image from the local registry Docker registry management useful commands
Log management
Command Description docker log -f CONTAINER_ID Prints out logs from CONTAINER_ID (-f = follow) Docker logs management
Info & Tips
Docker engine
Docker is made up of 3 components:
- Docker daemon
- REST API
- Docker CLI
When you install docker on a linux host, all 3 components are deployed.
Docker CLI can also be installed as single component and then used to run docker commands on a remote host with REST API and Docker daemon.
To run docker commands on a remote host:
docker -H=ip_of_remote_docker_engine:2375 run nginxDocker cgroups
To limit the % of CPU that can be assigned to a container (.5 = cannot use more than 50% of host CPU):
docker run --cpu=.5 ubuntuTo limit the amount of memory that can be allocated from a container:
docker run --memory=100m ubuntu