-
Prometheus-operator: How to configure email notifications for alerts
This guide relates to Prometheus-operator.
Whenever an alerting rule on Prometheus starts firing, the issue is only visible either accessing Prometheus web UI or from Grafana. In case you want it to trigger email notifications as well, follow this guide.
- Create a new Secret to store your SMTP server’s authentication password (only if it requires authentication)
- Sample yaml manifest:
apiVersion: v1
data:
  password: abcde==
kind: Secret
metadata:
  name: prometheus-smtp-settings
  namespace: monitoring
type: Opaque
- Create a new AlertmanagerConfig object
- Sample yaml manifest (replace SMTP settings according to your SMTP server):
apiVersion: monitoring.coreos.com/v1alpha1
kind: AlertmanagerConfig
metadata:
  name: prometheus-alertmanager-email-configs
  namespace: monitoring
  labels:
    alertmanagerConfig: email
spec:
  route:
    groupBy: ['alertname']
    groupWait: 10s
    groupInterval: 10s
    repeatInterval: 5m
    receiver: 'email'
  receivers:
  - name: 'email'
    emailConfigs:
    - to: 'test@test.com'
      from: 'test@test.com'
      smarthost: smtp.test.com:587
      authUsername: test@test.com
      authPassword:
        name: prometheus-smtp-settings
        key: password
      requireTLS: true
Filtering alerts based on their label
In case you want to filter alerts that should be routed to the receiver (“email”, from sample above), you can add a filtering rule as child of spec.route
Sample:
. . . spec: route: groupBy: ['alertname'] groupWait: 10s groupInterval: 10s repeatInterval: 5m receiver: 'email' matchers: - severity=~"critical|warning" . . .- Restart prometheus alertmanager:
$ kubectl delete -n monitoring $(kubectl get pods -n monitoring -l alertmanager=prometheus-kube-prometheus-alertmanager -o=name)
- Create a new Secret to store your SMTP server’s authentication password (only if it requires authentication)
-
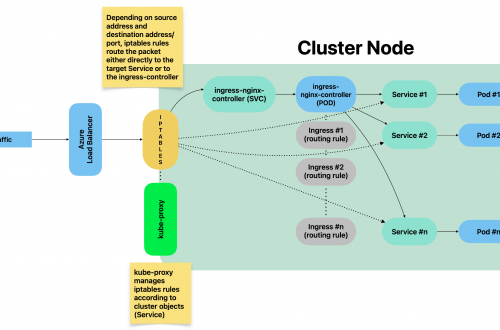
Prometheus-operator: How to add custom scrape targets
Prometheus-operator comes with pre-configured scrape targets to keep an eye on kubernetes cluster standard components. At some point, you might want to add some custom targets to monitor your application. This page shows you how to achieve it.
- Create a yaml manifest that includes all the extra custom scrape targets you want to add:
- Sample file: prometheus-additional.yaml
- job_name: "your_custom_job_name"
  static_configs:
  - targets: ["your_endpoint_providing_metrics:your_port"]
  metrics_path: "/a/b/c/metrics/application"
Target configuration settings
Value of “targets” can only be a hostname or ip address (typically: Your application pod’s Service name, e.g. podname.namespace.svc.cluster.local) and the corresponding port.
By default, in case you do NOT specify the “metrics_path”, prometheus will contact http://hostname:port/metrics
In case your application provides metrics to a different path, you must provide it as value of “metrics_path”.
- Create a Secret yaml manifest with name = additional-scrape-configs reading the content from file prometheus-additional.yaml created on step 1 above:
# kubectl create secret generic additional-scrape-configs --from-file=prometheus-additional.yaml --dry-run=client -o yaml > additional-scrape-configs.yaml
- Create a Secret using the yaml manifest generated on step 2 above and make sure to assign it to the same namespace in use by prometheus:
# kubectl apply -f additional-scrape-configs.yaml -n monitoring
- Edit your Prometheus CRD (Custom Resource Definition) and add a reference to your additional scrape configs (new block: spec.additionalScrapeConfigs):
# kubectl edit prometheus/prometheus-kube-prometheus-prometheus -n monitoring apiVersion: monitoring.coreos.com/v1 kind: Prometheus metadata: annotations: meta.helm.sh/release-name: prometheus meta.helm.sh/release-namespace: monitoring creationTimestamp: "2022-09-15T07:20:00Z" generation: 2 labels: app: kube-prometheus-stack-prometheus app.kubernetes.io/instance: prometheus app.kubernetes.io/managed-by: Helm app.kubernetes.io/part-of: kube-prometheus-stack app.kubernetes.io/version: 40.0.0 chart: kube-prometheus-stack-40.0.0 heritage: Helm release: prometheus name: prometheus-kube-prometheus-prometheus namespace: monitoring resourceVersion: "11481588" uid: 465362f4-a309-4022-94fb-62f5e22f4828 spec: additionalScrapeConfigs: key: prometheus-additional.yaml name: additional-scrape-configs . . .- Restart kube-prometheus and kube-operator pods:
# kubectl delete -n monitoring $(kubectl get pods -o=name -n monitoring -l app=kube-prometheus-stack-operator)
# kubectl delete -n monitoring $(kubectl get pods -o=name -n monitoring -l app.kubernetes.io/instance=prometheus-kube-prometheus-prometheus)
As soon as the new pods come up, metrics collected from your new targets will be accessible from Prometheus/Grafana.
- Create a yaml manifest that includes all the extra custom scrape targets you want to add:
-
Prometheus operator – how to add custom alerts
Learn how to add your custom rules to prometheus-operator running on kubernetes
Prometheus-operator comes with a set of pre-installed alerting rules, but typically you want to add extra ones, looking after your own application running on the kubernetes cluster.
This page shows you how.
- Create a new ConfigMap that includes all your new custom groups and related rules. Sample yaml manifest:
apiVersion: monitoring.coreos.com/v1 kind: PrometheusRule metadata: labels: prometheus: prometheus-kube-prometheus-prometheus role: alert-rules release: prometheus name: prometheus-test-rules namespace: monitoring spec: groups: - name: ./test.rules rules: - alert: No connections to external systems expr: (application_test_ext_system_total > 0) and (application_test_ext_system_connections_count_total == 0) for: 3m labels: severity: warning - name: ./test-ddos.rules rules: - alert: Detect anomalies on network traffic expr: (( rate(node_network_receive_packets_total[5m]) / rate(node_network_receive_packets_total[5m] offset 5m)) > 10) and ( rate(node_network_receive_packets_total[5m]) > 1000) for: 3m labels: severity: warning- Restart your prometheus master pod so that the new ConfigMap created above is loaded:
$ kubectl delete -n monitoring $(k get pods -n monitoring -o=name -l operator.prometheus.io/name=prometheus-kube-prometheus-prometheus)
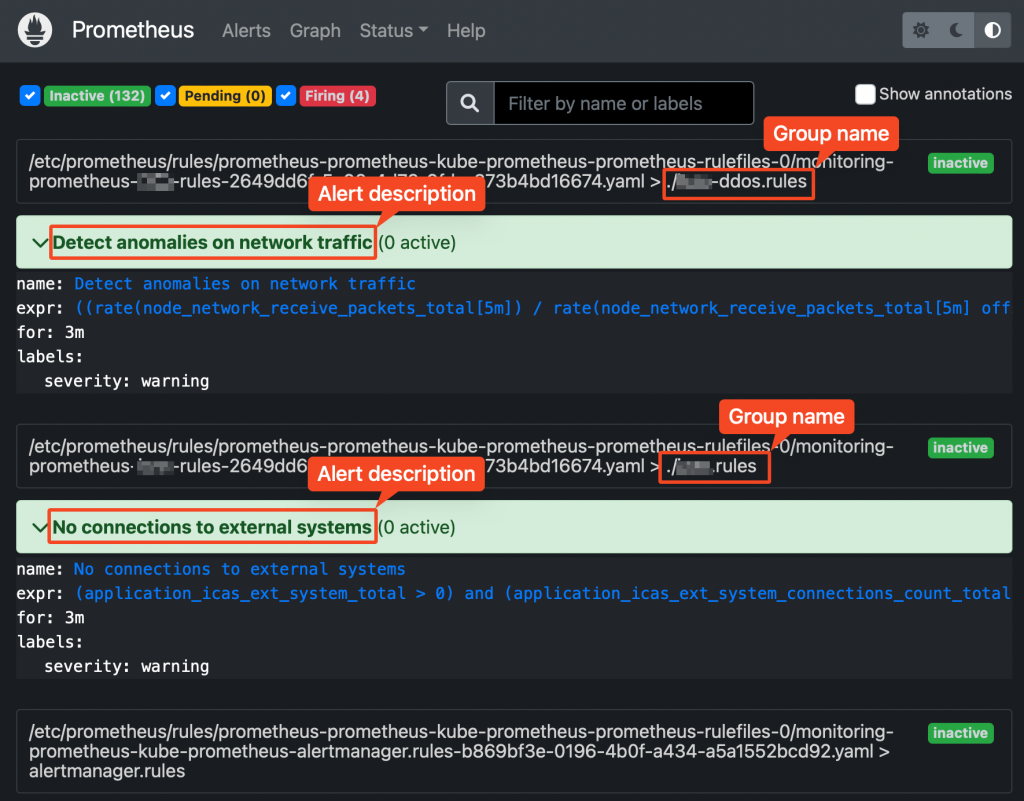
Prometheus web UI Checking rules validity
Alerting rules are going through a syntax check at prometheus core startup.
This can also be done upfront, using the “promtool” utility, part of prometheus core container.
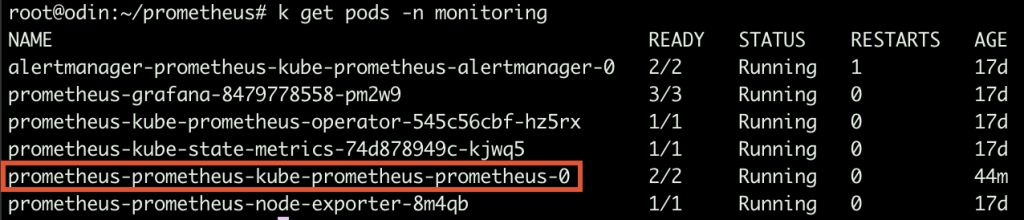
Prometheus running Pods Syntax:
$ promtool check config your_custom_rules_file.yaml
Sample rules yaml file:
groups:
- name: ./test.rules
  rules:
  - alert: No connections to external systems
    expr: (application_test_ext_system_total > 0) and (application_test_ext_system_connections_count_total == 0)
    for: 3m
    labels:
      severity: warning
- name: ./test-ddos.rules
  rules:
  - alert: Detect anomalies on network traffic
    expr: (( rate(node_network_receive_packets_total[5m]) / rate(node_network_receive_packets_total[5m] offset 5m)) > 10) and ( rate(node_network_receive_packets_total[5m]) > 1000)
    for: 3m
    labels:
      severity: warning
Prometheus does NOT check whether the metrics/labels you provide on the custom rules ConfigMap are valid and existing.
To retrieve the list of available metrics, you can create a new panel on Grafana and take advantage of auto-completion or just use the Prometheus web UI.
-
Accessing a webdav drive from Linux shell
Table of Contents
Option 1: Connect on an interactive session
Pre-requisites
- You need to retrieve the webdav URL from your provider. Sample:
https://testportal.com/remote.php/dav/files/your_username/- Install command line tool “cadaver” (installation method depends on your Linux distribution)
Connecting via “cadaver”
cadaver https://testportal.com/remote.php/dav/files/your_username/You will be prompted to provide your password. Once logged in, you will be connected to a webdav shell.
Available commands
ls [path]
    List contents of current [or other] collection
cd path
    Change to specified collection
pwd
    Display name of current collection
put local [remote]
    Upload local file
get remote [local]
    Download remote resource
mget remote...
    Download many remote resources
mput local...
    Upload many local files
edit resource
    Edit given resource
less remote...
    Display remote resource through pager
mkcol remote...
    Create remote collection(s)
cat remote...
    Display remote resource(s)
delete remote...
    Delete non-collection resource(s)
rmcol remote...
    Delete remote collections and ALL contents
copy source... dest
    Copy resource(s) from source to dest
move source... dest
    Move resource(s) from source to dest
lock resource
    Lock given resource
unlock resource
    Unlock given resource
discover resource
    Display lock information for resource
steal resource
    Steal lock token for resource
showlocks
    Display list of owned locks
propnames res
    Names of properties defined on resource
chexec [+|-] remote
    Change isexecutable property of resource
propget res [propname]
    Retrieve properties of resource
propset res propname value
    Set property on resource
set [option] [value]
    Set an option, or display options
open URL
    Open connection to given URL
close
    Close current connection
quit
    Exit program
unset [option] [value]
    Unsets or clears value from option.
lcd [directory]
    Change local working directory
lls [options]
    Display local directory listing
lpwd
    Print local working directory
logout
    Logout of authentication session
help [command]
    Display help message
Option #2: Mount the remote webdav as a local folder
I find this method much more convenient.
- Install davfs file system drivers
- apt-get install davfs2 or yum install davfs2
- Add your local user to “davfs” group
- usermod -aG davfs2 <username>
- Create a local folder to use as mount point
- mkdir /yourmountpoint
- Create a folder to store your users’s davfs settings
- mkdir ~/.davfs2
- Copy davfs global settings to your user’s folder
- cp /etc/davfs2/secrets ~/.davfs2/secrets
- Add an entry to /etc/fstab:
https://testportal.com/remote.php/dav/files/your_username/ /yourmountpoint davfs user,rw,noauto 0 0- Mount the share
- mount /yourmountpoint
-
Linux swap partition management
Table of Contents
Creating a new swap space from a new disk
- Format the new partition with:
mkswap /dev/sdx1- Add the new swap partition to /etc/fstab
/dev/sdx1 swap swap defaults 0 0- Run swapon -a to activate the new swap.
Creating a new swap file
Create the file. This command creates a 1 gigabyte file:
dd if=/dev/zero of=/swap bs=1M count=1000Format the swap file:
mkswap /swapAdd the new swap file to /etc/fstab:
/swap swap swap defaults 0 0Run swapon -a to activate immediately the new swap space.
Deactivating an existing swap space
- Run “swapoff -a“
- Comment / delete the related entry on file /etc/fstab
/dev/sdx1 swap swap defaults 0 0