-
Kubernetes security: Detect and react to intrusions with Falco
Table of Contents
Intro
Falco is an open-source application that you can use to detect (and, optionally, react) intrusions.
It comes with a set of pre-installed rules to which exceptions can be easily added.
Custom rules can of course be installed as well.
Events can be fetched both interacting with a kernel module, eBPF probes are also supported.
This guide covers first use-case above and relates to deployment via helm chart within a kubernetes cluster.
Installation
Pre-requisites
This guide assumes you have a pre-installed kubernetes cluster (on-premise) with all necessary configurations to use kubectl.
Debian / Ubuntu based OS
Install packages required to fetch syscall from host OS kernel:
curl -s https://falco.org/repo/falcosecurity-3672BA8F.asc | apt-key add -
echo "deb https://download.falco.org/packages/deb stable main" | tee -a /etc/apt/sources.list.d/falcosecurity.list
apt-get update -y
apt-get -y install linux-headers-$(uname -r)
CentOS/RHEL/Fedora/Amazon Linux based OS
rpm --import https://falco.org/repo/falcosecurity-3672BA8F.asc
curl -s -o /etc/yum.repos.d/falcosecurity.repo https://falco.org/repo/falcosecurity-rpm.repo
yum -y install kernel-devel-$(uname -r)
Installing via helm chart
helm repo add falcosecurity https://falcosecurity.github.io/charts
helm repo update
Now, create the namespace:
kubectl create namespace falco
Create a new PersistentVolume. Make sure to replace the following attributes according to your needs/environment:
- spec.capacity.storage
- spec.local.path (pathname of local directory on your host node)
- spec.nodeAffinity.required.nodeSelectorTerms.matchExpressions.key.value (must match your k8s node’s name)
apiVersion: v1
kind: PersistentVolume
metadata:
  annotations:
  finalizers:
  - kubernetes.io/pv-protection
  name: redis-data
  namespace: falco
spec:
  accessModes:
  - ReadWriteOnce
  capacity:
    storage: 5Gi
  local:
    path: YOUR_LOCAL_PATH_HERE
  nodeAffinity:
    required:
      nodeSelectorTerms:
      - matchExpressions:
        - key: kubernetes.io/hostname
          operator: In
          values:
          - YOUR_NODE_NAME_HERE
  persistentVolumeReclaimPolicy: Retain
  volumeMode: Filesystem
Install the helm chart:
helm install falco \
  --set falco.grpc.enabled=true \
  --set falco.grpc_output.enabled=true \
  --set falcosidekick.enabled=true \
  --set falcosidekick.webui.enabled=true \
  falcosecurity/falco \
  --namespace falco
Make sure all pods are up and running:
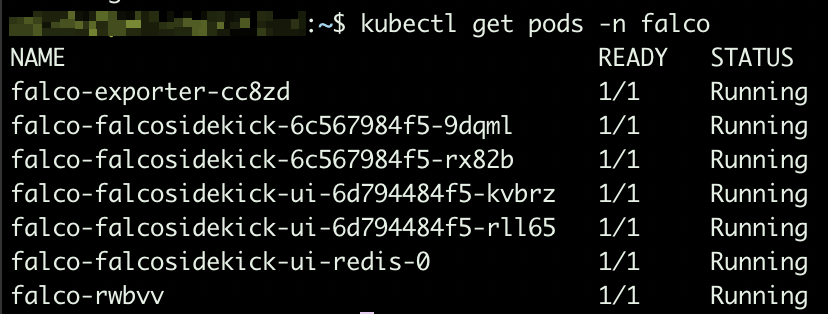
Falco pods Based on the arguments we provided while installing the helm chart, sidekick UI is enabled. To make it accessible, you will have to expose port 2802:
kubectl expose service falco-falcosidekick-ui --port=2802 --target-port=2802 --external-ip=YOUR_NODE_IP_ADDRESS --name=falco-falcosidekick-ui-external -n falco
From this moment, you should be able to access sidekick UI at http://YOUR_NODE_IP_ADDRESS:2802
Default credentials: admin/admin
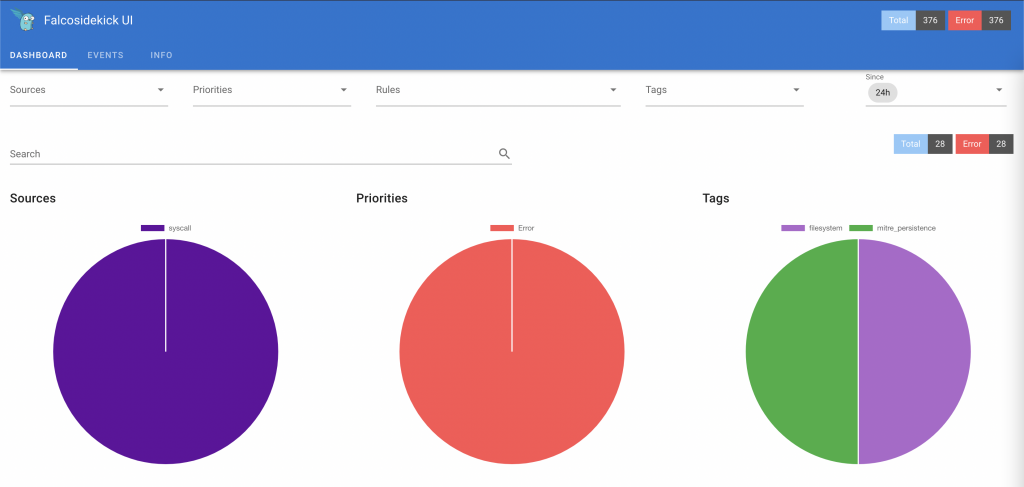
Falco sidekick UI Adding rules exceptions
You might need to add exceptions to pre-installed rules since they might be too restrictive based on how you use this system.
To do so, create a yaml file (e.g. rules_exceptions.yaml) and add your exceptions.
Sample:
customRules:
  custom_rules_from_default: |-
    - rule: Read sensitive file untrusted
      append: true
      exceptions:
      - name: microsoft_omsagent_plugin
        fields: [container.id, fd.name, proc.cmdline, proc.name, proc.pname, user.name]
        comps: [=, =, =, =, =, =]
        values:
        - [host, /etc/shadow, omsbaseline -d /opt/microsoft/omsagent/plugin/, omsbaseline, omsbaseline, root]
      - name: wdavdaemon
        fields: [proc.name]
        comps: [=]
        values:
        - [wdavdaemon]
2nd rule above (name: wdavdaemon) will not fire any alert in case default settings for rule “wdavdaemon” are satisfied but the syscall attribute proc.name = “wdavdaemon”.
1st rule above is providing an exception based on value from multiple attributes (container.id, fd.name, etc.)
To install the new rule file, upgrade the helm chart:
helm upgrade --install falco falcosecurity/falco --namespace falco --reuse-values -f rules_exceptions.yaml
Whenever an event breaks a security rule, it gets logged to stdout.
Exporting events to Prometheus
stdout from falco core can be made available as application metric so that Prometheus can easily scrape such endpoint and have access to all events.
To do so, we need to deploy an extra component: Falco exporter (see https://github.com/falcosecurity/falco-exporter)
This component can be easily installed via helm chart:
helm install falco-exporter falcosecurity/falco-exporter --namespace falco
Falco-exporter is available, by default, on port 9376. In case your Prometheus instance is running on a different host, you will have to expose the port:
helm install falco-exporter falcosecurity/falco-exporter --namespace falco
 kubectl expose service falco-exporter --port=9376 --target-port=9376 --external-ip=YOUR_NODE_IP_HERE --name=falco-exporter-external -n falco
From this moment, you can add http://YOUR_NODE_IP:9376 as additional scrape target to your Prometheus configuration.
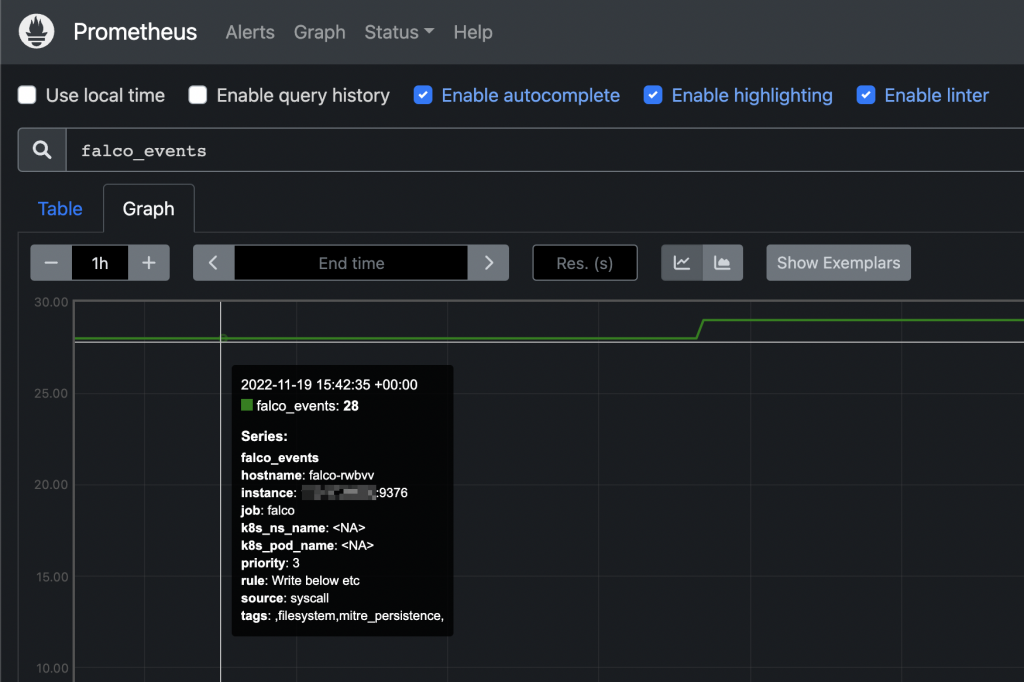
Falco events on Prometheus UI From this moment you can add custom alerts on Prometheus or, even better, create your owns from Grafana’s UI.
Adding custom alerts to Prometheus How to send email notifications from Grafana alerts -
Linux Logical Volume Management
Table of Contents
Creating a logical volume and volume group
- Make sure the physical disk is listed as block device
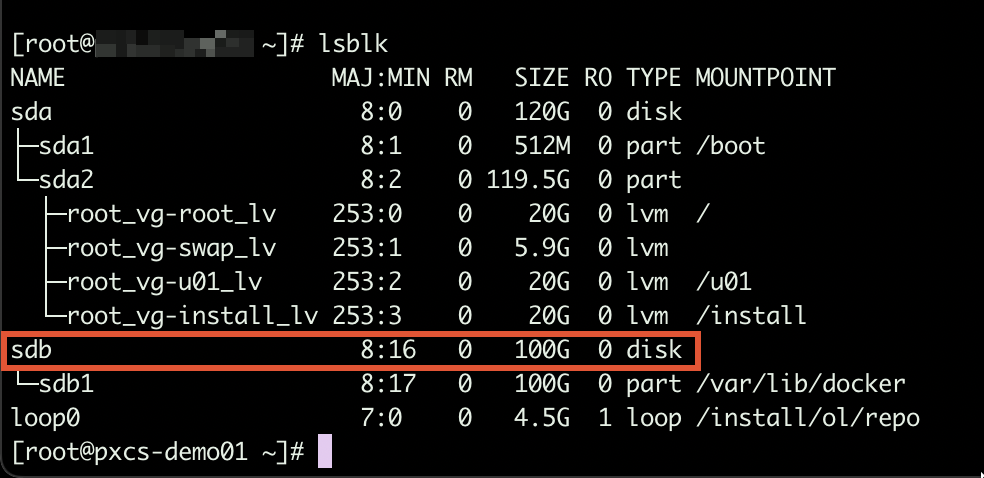
Checking block devices with lsblk - Create a new primary partition on the disk (partition type = 8e)
fdisk /dev/sdx # Replace "sdx" with your block device real name
n # create new partition
p # New primary partition
1 # select Partition number (1-4) <Enter>
# partition size: Accept the default values in case you want to use the full disk available space
t # set partition type LVM linux is 8e
1 # select partition
8e # for linux lvm
w # to write
- Create a new physical volume related to the partition created above
# Physical volume creation (Replace sdx with your block device name)
pvcreate /dev/sdx1
- Create a new volume group and include the pv mentioned above to it
vgcreate testdata_vg /dev/sdx1
- Create a new logical volume as child of the volume group above, you can specify a constant size or use 100% of the volumes currently part of the volume group above
Sample 1: New logical volume with size 20 GB
lvcreate -L 20000 -n vol01 testdata_vg

Sample 2: New logical volume using 100% of available space
lvcreate -l 100%FREE -n vol01 testdata_vg
- Format the logical volume created above
Sample: Format as ext4
mkfs.ext4 /dev/testdata_vg/vol01
You can now mount the volume (device name: /dev/testdta_vg/vol01).
Extending an exiting logical volume
Adding an extra disk
- Make sure the new disk is listed as block device (lsblk)
- Create a new partition on the new disk and set the type to 8e (see instructions above)
- Create a new physical volume
pvcreate /dev/sdx1
- Extend the volume group adding the new pv to the volume group
vgextend /dev/testdata_vg /dev/sdx1
- Extend the logical volume so that is can use all space available now on the volume group
lvextend -l +100%FREE /dev/testdata_vg/vol01
- Double check that the new volume is now part of the existing volume group (lsblk)
- Unmount the volume group
umount /your_volume_group_mount_point
- Check the file system integrity (ext filesystems only)
e2fsck -f /dev/testdata_vg/vol01
- Extend the file system (command for ext file systems)
resize2fs /dev/testdata_vg/vol01
- Extend the file system (command for xfs file systems)
Make sure that volume group is mounted before to issue the command below
xfs_grows /dev/testdata_vg/vol01
- Mount the drive (if not already mounted . . .)
mount /your_volume_group_mount_point
- Double check that now the volume group is using all new available disk space
df -h
Adding extra space added to an already existing disk
- Check the current partitions on extended physical disk
fdisk -l /dev/sdx
- Create a new primary partition and set type to 8e (see instructions above)
- Create a new physical volume
- Extend the volume group adding the new physical volume to the volume group
vgextend /dev/testdata_vg /dev/sdx1
- Extend the logical volume so that is can use all available size of the volume group
lvextend -l +100%FREE /dev/testdata_vg/vol01
- Check the integrity (ext file systems only)
e2fsck -f /dev/testdata_vg/vol01
- Extend the file system (command for ext file systems)
resize2fs /dev/testdata_vg/vol01
- Extend the file system (command for xfs file systems)
Make sure that volume group is mounted before to issue the command below
xfs_grows /dev/testdata_vg/vol01
- Mount the drive (if not already mounted . . .)
mount /your_volume_group_mount_point
- Double check that now the volume group is using all new available disk space
df -h
Troubleshooting
mkfs command takes a very long time
To run mkfs without trim, use the -K option on XFS and -E nodiscard on ext4.
XFS:
mkfs.xfs -K /dev/sdx
EXT4:
mkfs.ext4 -E nodiscard /dev/sdx
lsblk/df does not show volume changes
Reload the partition table with the command ‘partprobe’
A new disk has been attached to the VM, but it’s not listed as block device
Option #1: Reboot the VM
Option #2: Force the OS to scan list of attached block devices:
for host in /sys/class/scsi_host/*; do echo "- - -" | sudo tee $host/scan; ls /dev/sd* ; done
-
Monitoring application health with blackbox-exporter
Prometheus standard deployment and configuration has already been discussed on other posts, but what if you want to expose metrics about your custom application stack health? This page explains how to achieve this, by taking advantage of blackbox-exporter, so that your application components running on a kubernetes cluster will be easily monitored.
Intro
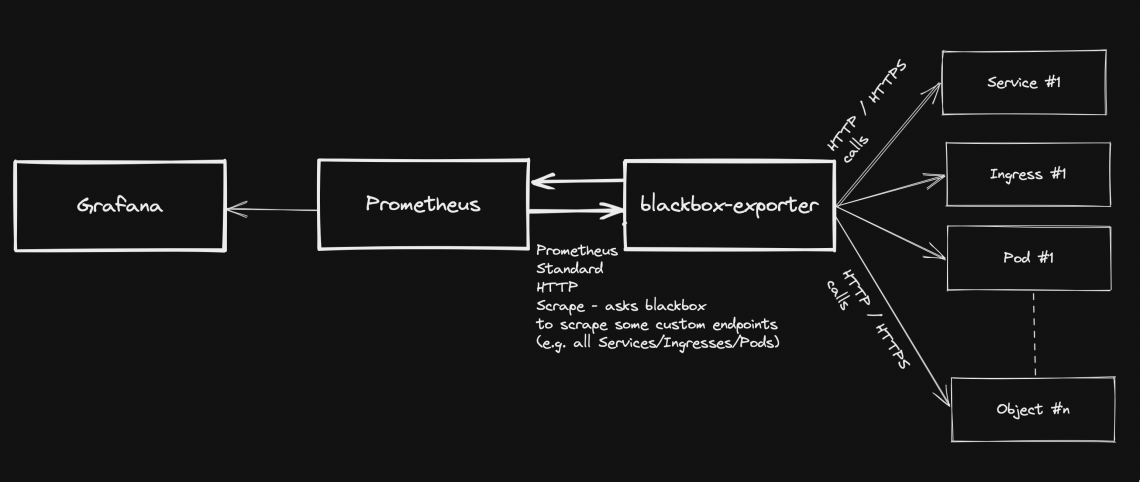
Generally speaking, blackbox stands in between your Prometheus instance and your custom application components: Prometheus fetches metrics asking blackbox to target custom endpoints. Response will be given back using the format expected by Prometheus. Endspoints are typically your cluster’s Pods, Services and Ingresses.
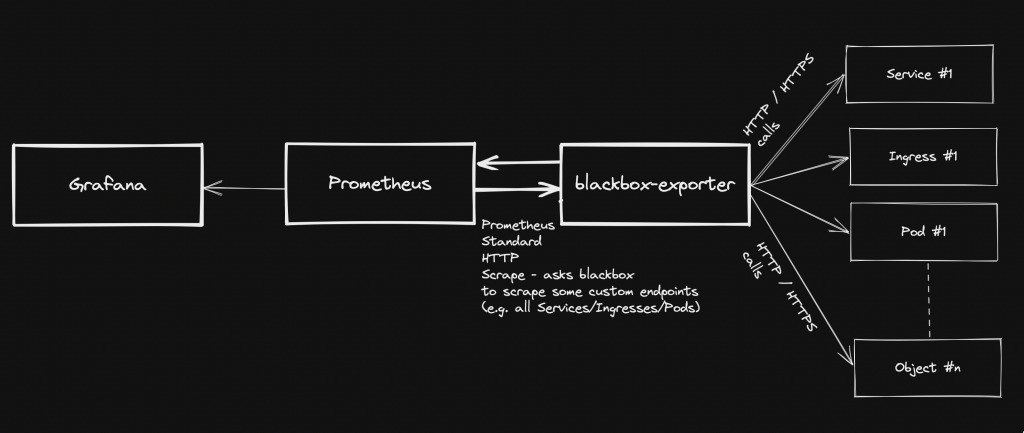
Overview Pre-requirements
- A kubernetes cluster with kubectl configured to interact with it
- Prometheus-operator stack – see https://github.com/prometheus-operator/prometheus-operator
- Grafana (part of Prometheus-operator)
blackbox-exporter installation (via helm chart)
- Add the helm repo
helm repo add prometheus-community https://prometheus-community.github.io/helm-charts
help repo update
- Create a file: values.yaml
config: modules: http_2xx: prober: http timeout: 5s http: valid_http_versions: ["HTTP/1.1", "HTTP/2.0"] follow_redirects: true preferred_ip_protocol: "ip4"- Install the helm chart (in this case, we are using “monitoring” namespace):
helm install prometheus-blackbox prometheus-community/prometheus-blackbox-exporter -n monitoring -f values.yaml
Adding custom scrape targets to blackbox
As regards how to add extra scrape targets, see https://matteorenzi.com/2022/10/08/prometheus-operator-how-to-add-custom-scrape-targets/
Below some sample targets that you might want to add:
Probing external targets (sample: www.google.com)
- job_name: 'blackbox-external-targets'
  metrics_path: /probe
  params:
    module: [http_2xx]
  static_configs:
    - targets:
      - https://www.google.com
  relabel_configs:
    - source_labels: [__address__]
      target_label: __param_target
    - source_labels: [__param_target]
      target_label: instance
    - target_label: __address__
      replacement: prometheus-blackbox-prometheus-blackbox-exporter.monitoring.svc.cluster.local:9115
Probing your cluster Services
- job_name: "blackbox-kubernetes-services"
  metrics_path: /probe
  params:
    module: [http_2xx]
  kubernetes_sd_configs:
  - role: service
  relabel_configs:
    - source_labels: [__address__]
      target_label: __param_target
    - target_label: __address__
      replacement:  prometheus-blackbox-prometheus-blackbox-exporter.monitoring.svc.cluster.local:9115
    - source_labels: [__param_target]
      target_label: instance
    - action: labelmap
      regex: __meta_kubernetes_service_label_(.+)
    - source_labels: [__meta_kubernetes_namespace]
      target_label: kubernetes_namespace
    - source_labels: [__meta_kubernetes_service_name]
      target_label: kubernetes_service_name
Probing cluster Ingresses
- job_name: "blackbox-kubernetes-ingresses"
  metrics_path: /probe
  params:
    module: [http_2xx]
  kubernetes_sd_configs:
  - role: ingress
  relabel_configs:
    - source_labels:
        [
          __meta_kubernetes_ingress_scheme,
          __address__,
          __meta_kubernetes_ingress_path,
        ]
      regex: (.+);(.+);(.+)
      replacement: ://
      target_label: __param_target
    - target_label: __address__
      replacement: prometheus-blackbox-prometheus-blackbox-exporter.monitoring.svc.cluster.local:9115
    - source_labels: [__param_target]
      target_label: instance
    - action: labelmap
      regex: __meta_kubernetes_ingress_label_(.+)
    - source_labels: [__meta_kubernetes_namespace]
      target_label: kubernetes_namespace
    - source_labels: [__meta_kubernetes_ingress_name]
      target_label: ingress_name
Probing cluster Pods
- job_name: "blackbox-kubernetes-pods"
  metrics_path: /probe
  params:
    module: [http_2xx]
  kubernetes_sd_configs:
  - role: pod
  relabel_configs:
    - source_labels: [__address__]
      target_label: __param_target
    - target_label: __address__
      replacement: prometheus-blackbox-prometheus-blackbox-exporter.monitoring.svc.cluster.local:9115
    - source_labels: [__param_target]
      replacement: /health
      target_label: instance
    - action: labelmap
      regex: __meta_kubernetes_pod_label_(.+)
    - source_labels: [__meta_kubernetes_namespace]
      target_label: kubernetes_namespace
    - source_labels: [__meta_kubernetes_pod_name]
      target_label: kubernetes_pod_name
Checking new targets / probes
Once the new scraping targets have been applied, they must be visible on Prometheus: Status -> Targets
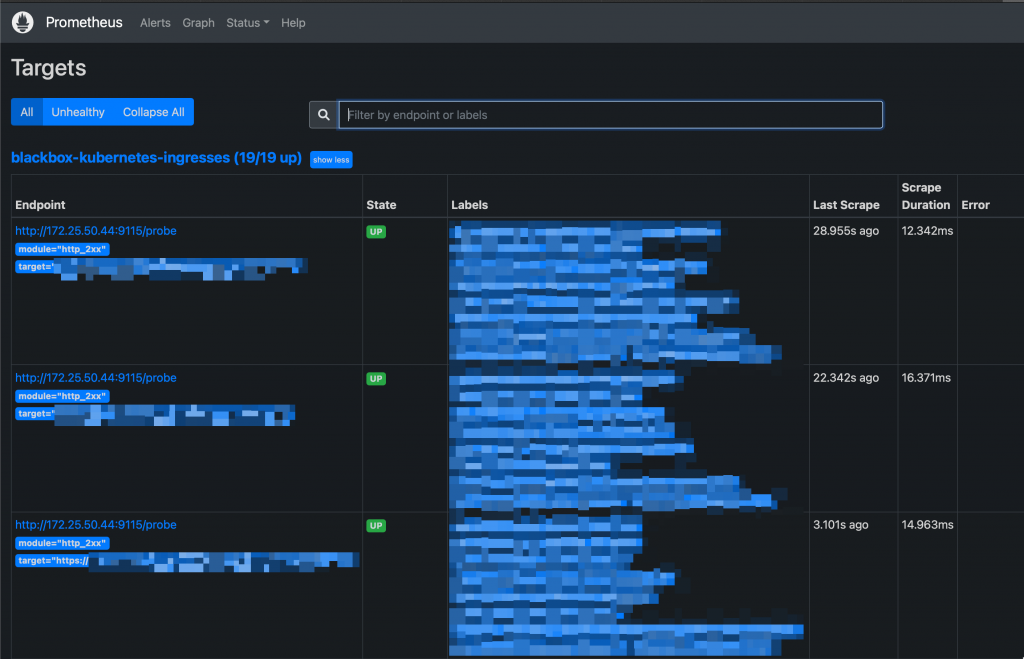
New Targets on Prometheus UI Probes can be queried like this:
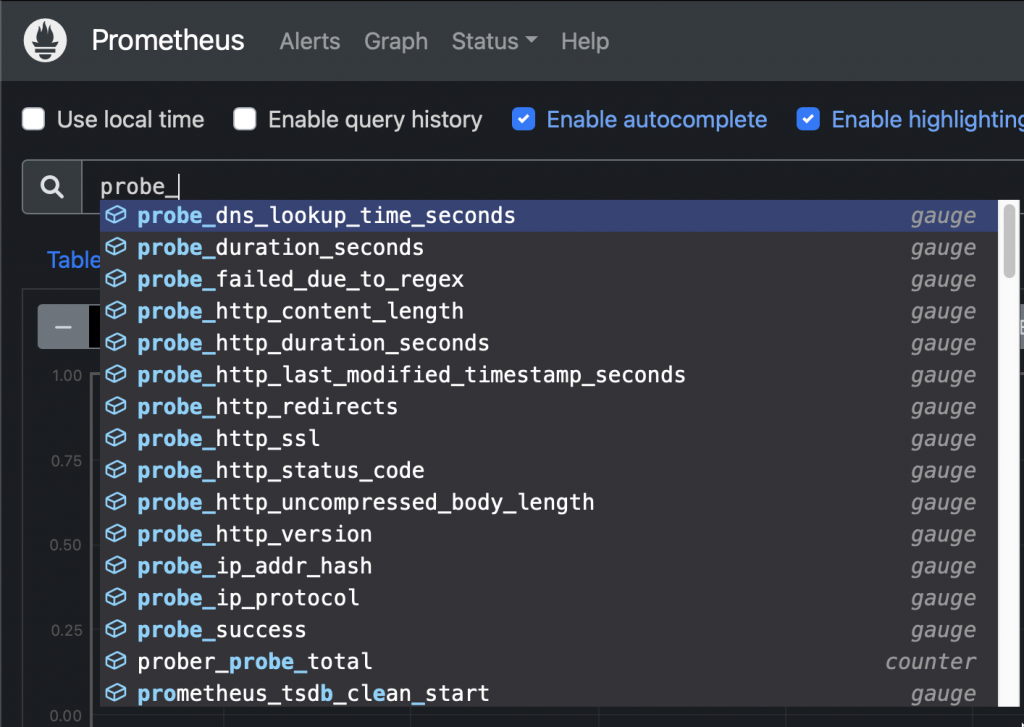
New probes Sample query: Check HTTP status code from an ingress:
probe_http_status_code{ingress_name="xxxxx"}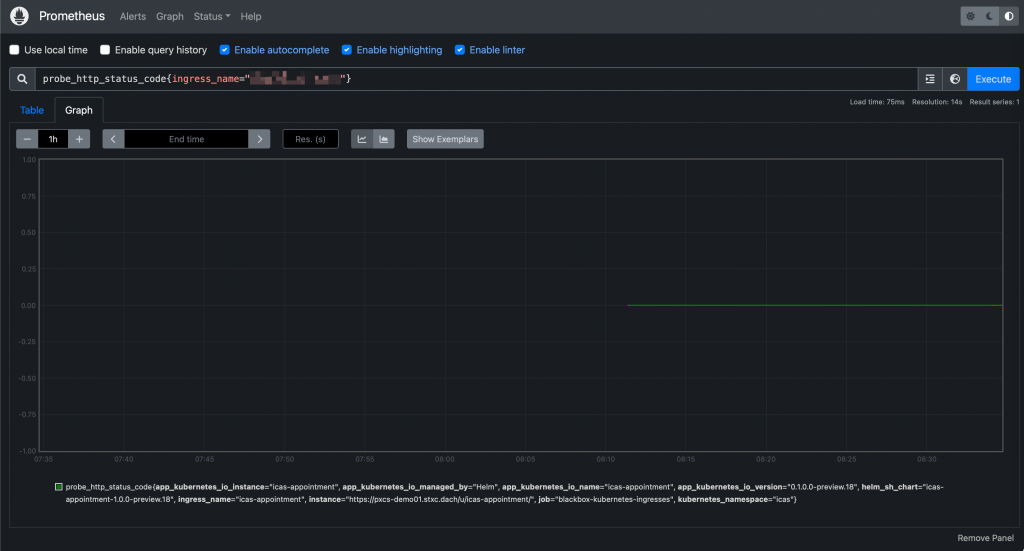
Prometheus UI: Querying a probe And they will be accessible from Grafana as well:
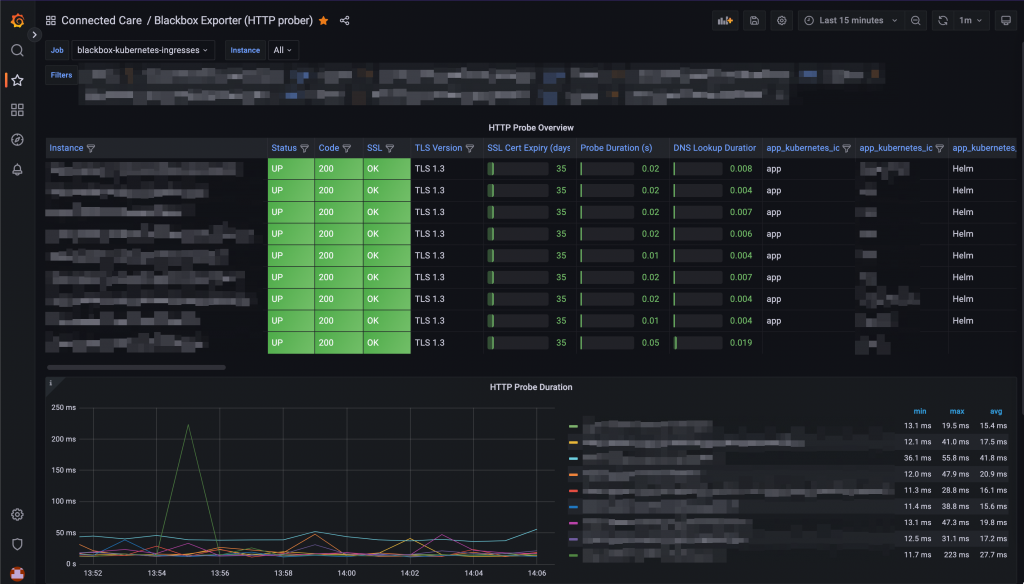
Probes visualisation on a Grafana dashboard -
Grafana running on kubernetes: How to configure SMTP integration
Grafana has a built-in alerting system and it can be used to trigger email notifications whenever an alert is raised. This page shows you how to configure the integration with an external SMTP server.
- Create a ConfigMap that includes the grafana.ini main configuration file
- Sample ConfigMap yaml manifest:
apiVersion: v1 data: grafana.ini: | [analytics] check_for_updates = true [grafana_net] url = https://grafana.net [log] mode = console [paths] data = /var/lib/grafana/ logs = /var/log/grafana plugins = /var/lib/grafana/plugins provisioning = /etc/grafana/provisioning [server] domain = [smtp] enabled = true host = smtp.test.com:587 user = test@test.com password = xxxxxxxxx startTLS_policy = MandatoryStartTLS skip_verify = true from_address = test@test.com from_name = Grafana kind: ConfigMap metadata: annotations: meta.helm.sh/release-name: prometheus meta.helm.sh/release-namespace: monitoring labels: app.kubernetes.io/instance: prometheus app.kubernetes.io/managed-by: Helm app.kubernetes.io/name: grafana app.kubernetes.io/version: 9.1.4 helm.sh/chart: grafana-6.38.0 name: prometheus-grafana namespace: monitoring- Restart grafana pod(s) to apply the new config described above:
# kubectl delete -n monitoring $(kubectl get pods -n monitoring -o=name -l app.kubernetes.io/name=grafana)
- Create a ConfigMap that includes the grafana.ini main configuration file
-
Prometheus-operator: How to modify or delete pre-installed alerts
This guide relates to Prometheus-operator.
Prometheus-operator operator comes with a set of pre-installed alerts. This page shows you how to edit/remove them.
- Prometheus operator stores rules into PrometheusRule objects. In case you found a rule by looking into the Prometheus web UI, first thing you have to do is determine the group name:
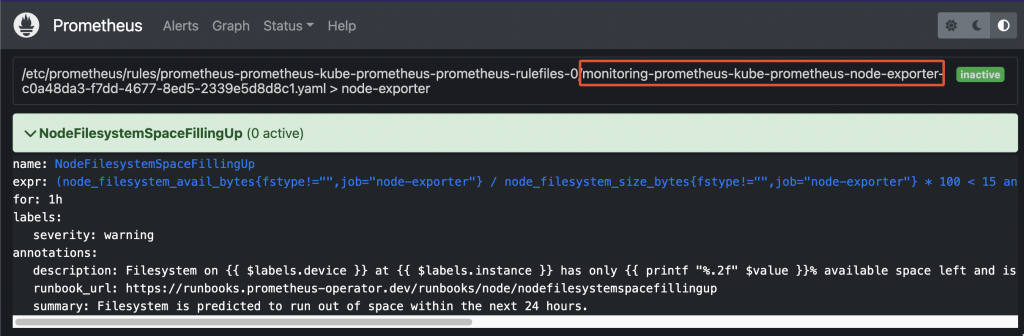
Prometheus pre-existing rule - Now, retrieve the list of all PrometheusRule objects available within the cluster:
root@odin:~/prometheus# kubectl get prometheusrule -n monitoring
NAME                                                              AGE
prometheus-icas-rules                                             7d2h
prometheus-kube-prometheus-alertmanager.rules                     22d
prometheus-kube-prometheus-config-reloaders                       22d
prometheus-kube-prometheus-etcd                                   22d
prometheus-kube-prometheus-general.rules                          22d
prometheus-kube-prometheus-k8s.rules                              22d
prometheus-kube-prometheus-kube-apiserver-availability.rules      22d
prometheus-kube-prometheus-kube-apiserver-burnrate.rules          22d
prometheus-kube-prometheus-kube-apiserver-histogram.rules         22d
prometheus-kube-prometheus-kube-apiserver-slos                    22d
prometheus-kube-prometheus-kube-prometheus-general.rules          22d
prometheus-kube-prometheus-kube-prometheus-node-recording.rules   22d
prometheus-kube-prometheus-kube-scheduler.rules                   22d
prometheus-kube-prometheus-kube-state-metrics                     22d
prometheus-kube-prometheus-kubelet.rules                          22d
prometheus-kube-prometheus-kubernetes-apps                        22d
prometheus-kube-prometheus-kubernetes-resources                   22d
prometheus-kube-prometheus-kubernetes-storage                     22d
prometheus-kube-prometheus-kubernetes-system                      22d
prometheus-kube-prometheus-kubernetes-system-apiserver            22d
prometheus-kube-prometheus-kubernetes-system-controller-manager   22d
prometheus-kube-prometheus-kubernetes-system-kube-proxy           22d
prometheus-kube-prometheus-kubernetes-system-kubelet              22d
prometheus-kube-prometheus-kubernetes-system-scheduler            22d
prometheus-kube-prometheus-node-exporter                          22d    <------
prometheus-kube-prometheus-node-exporter.rules                    22d
prometheus-kube-prometheus-node-network                           22d
prometheus-kube-prometheus-node.rules                             22d
prometheus-kube-prometheus-prometheus                             22d
prometheus-kube-prometheus-prometheus-operator                    22d
- Now you can edit the object and change/delete the rule:
root@odin:~/prometheus# kubectl edit prometheusrule/prometheus-kube-prometheus-node-exporter -n monitoring


# Please edit the object below. Lines beginning with a '#' will be ignored,
# and an empty file will abort the edit. If an error occurs while saving this file will be
# reopened with the relevant failures.
#
apiVersion: monitoring.coreos.com/v1
kind: PrometheusRule
metadata:
  annotations:
    meta.helm.sh/release-name: prometheus
    meta.helm.sh/release-namespace: monitoring
  creationTimestamp: "2022-09-15T07:20:01Z"
  generation: 1
  labels:
    app: kube-prometheus-stack
    app.kubernetes.io/instance: prometheus
    app.kubernetes.io/managed-by: Helm
    app.kubernetes.io/part-of: kube-prometheus-stack
    app.kubernetes.io/version: 40.0.0
    chart: kube-prometheus-stack-40.0.0
    heritage: Helm
    release: prometheus
  name: prometheus-kube-prometheus-node-exporter
  namespace: monitoring
  resourceVersion: "8740458"
  uid: c0a48da3-f7dd-4677-8ed5-2339e5d8d8c1
spec:
  groups:
  - name: node-exporter
    rules:
    - alert: NodeFilesystemSpaceFillingUp
      annotations:
        description: Filesystem on {{ $labels.device }} at {{ $labels.instance }}
          has only {{ printf "%.2f" $value }}% available space left and is filling
          up.
        runbook_url: https://runbooks.prometheus-operator.dev/runbooks/node/nodefilesystemspacefillingup
        summary: Filesystem is predicted to run out of space within the next 24 hours.
      expr: |-
        (
          node_filesystem_avail_bytes{job="node-exporter",fstype!=""} / node_filesystem_size_bytes{job="node-exporter",fstype!=""} * 100 < 15
        and
          predict_linear(node_filesystem_avail_bytes{job="node-exporter",fstype!=""}[6h], 24*60*60) < 0
        and
          node_filesystem_readonly{job="node-exporter",fstype!=""} == 0
        )
      for: 1h
      labels:
        severity: warning
. . .